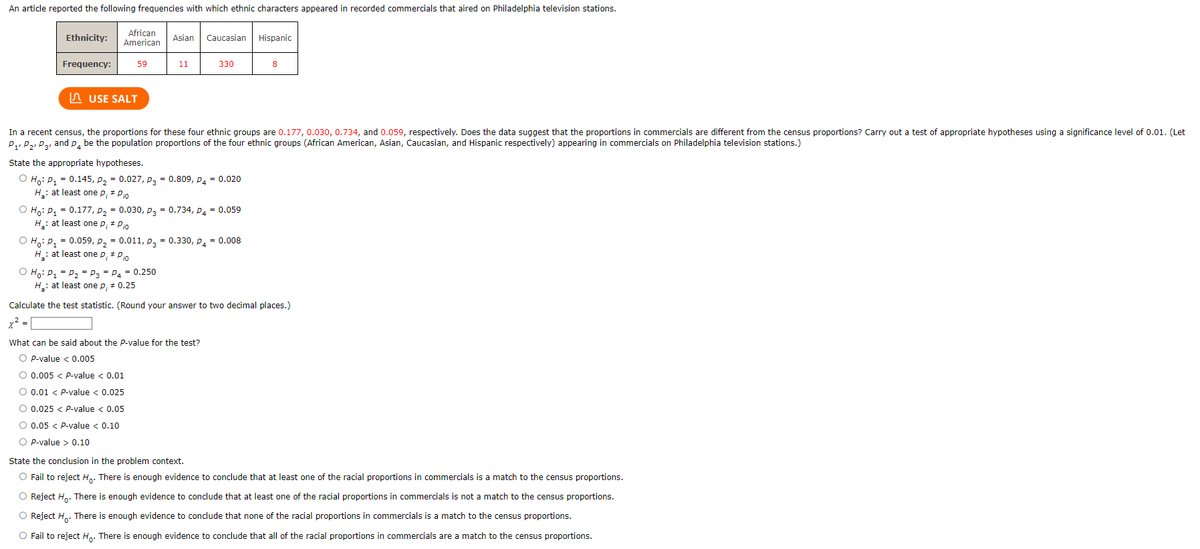
n article reported the following frequencies with which ethnic characters appeared in recorded commercials that aired on Philadelphia television stations. African American Ethnicity: Frequency: 59 USE SALT Asian Caucasian Hispanic a recent census, the proportions for these four ethnic groups are 0.177, 0.030, 0.734, and 0.059, respectively. Does the data suggest that the proportions in commercials are different from the census proportions? Carry out a test of appropriate hypotheses using a significance level of 0.01. (Le PP₂, and p be the population proportions of the four ethnic groups (African American, Asian, Caucasian, and Hispanic respectively) appearing in commercials on Philadelphia television stations.) tate the appropriate hypotheses. Ho: P₂ -0.145, P₂ -0.027, p=0.809, P4 -0.020 H.: at least one p, P Ho: P₁0.177, P₂-0.030, P₂-0.734, P4 -0.059 H.: at least one p, *P O Ho: Pg P₂P-P-0.250 H.: at least one p, * 0.25 330 O Ho: P₂ -0.059, P₂-0.011, P₂-0.330, P-0.008 H₁: at least one p, Po What can be said about the P-value for the test? O P-value < 0.005 O 0.005 < P-value < 0.01 O 0.01 < P-value < 0.025 alculate the test statistic. (Round your answer to two decimal places.) 2-[ O 0.025 < P-value < 0.05 O 0.05 < P-value < 0.10 OP-value > 0.10 8 tate the conclusion in the problem context. O Fail to reject H. There is enough evidence to conclude that at least one of the racial proportions in commercials is a match to the census proportions.
n article reported the following frequencies with which ethnic characters appeared in recorded commercials that aired on Philadelphia television stations. African American Ethnicity: Frequency: 59 USE SALT Asian Caucasian Hispanic a recent census, the proportions for these four ethnic groups are 0.177, 0.030, 0.734, and 0.059, respectively. Does the data suggest that the proportions in commercials are different from the census proportions? Carry out a test of appropriate hypotheses using a significance level of 0.01. (Le PP₂, and p be the population proportions of the four ethnic groups (African American, Asian, Caucasian, and Hispanic respectively) appearing in commercials on Philadelphia television stations.) tate the appropriate hypotheses. Ho: P₂ -0.145, P₂ -0.027, p=0.809, P4 -0.020 H.: at least one p, P Ho: P₁0.177, P₂-0.030, P₂-0.734, P4 -0.059 H.: at least one p, *P O Ho: Pg P₂P-P-0.250 H.: at least one p, * 0.25 330 O Ho: P₂ -0.059, P₂-0.011, P₂-0.330, P-0.008 H₁: at least one p, Po What can be said about the P-value for the test? O P-value < 0.005 O 0.005 < P-value < 0.01 O 0.01 < P-value < 0.025 alculate the test statistic. (Round your answer to two decimal places.) 2-[ O 0.025 < P-value < 0.05 O 0.05 < P-value < 0.10 OP-value > 0.10 8 tate the conclusion in the problem context. O Fail to reject H. There is enough evidence to conclude that at least one of the racial proportions in commercials is a match to the census proportions.
Glencoe Algebra 1, Student Edition, 9780079039897, 0079039898, 2018
18th Edition
ISBN:9780079039897
Author:Carter
Publisher:Carter
Chapter10: Statistics
Section10.6: Summarizing Categorical Data
Problem 4BGP
Related questions
Question

Transcribed Image Text:An article reported the following frequencies with which ethnic characters appeared in recorded commercials that aired on Philadelphia television stations.
Ethnicity:
Frequency:
African
American
59
USE SALT
Asian
11
Caucasian Hispanic
O Ho: P₁ = P₂ = P3 P4 = 0.250
H₂: at least one p; # 0.25
330
In a recent census, the proportions for these four ethnic groups are 0.177, 0.030, 0.734, and 0.059, respectively. Does the data suggest that the proportions in commercials are different from the census proportions? Carry out test of appropriate hypotheses using a significance level of 0.01. (Let
P₁, P₂, P3, and P4 be the population proportions of the four ethnic groups (African American, Asian, Caucasian, and Hispanic respectively) appearing in commercials on Philadelphia television stations.)
State the appropriate hypotheses.
O Ho: P₁ = 0.145, P₂ = 0.027, P = 0.809, P4 = 0.020
H₂: at least one p₁ # Pio
O Ho: P₁ = 0.177, P₂ = 0.030, P3 = 0.734, P4 = 0.059
H₂: at least one p; # Pio
O Ho: P₁0.059, P₂ = 0.011, P3 0.330, P4 = 0.008
H₂: at least one p, * Pio
What can be said about the P-value for the test?
O P-value < 0.005
O 0.005 < P-value < 0.01
O 0.01 < P-value < 0.025
O 0.025 < P-value < 0.05
O 0.05 < P-value < 0.10
O P-value > 0.10
8
Calculate the test statistic. (Round your answer to two decimal places.)
x² =
State the conclusion in the problem context.
O Fail to reject Ho. There is enough evidence to conclude that at least one of the racial proportions in commercials is a match to the census proportions.
O Reject Ho. There is enough evidence to conclude that at least one of the racial proportions in commercials is not a match to the census proportions.
O Reject Ho. There is enough evidence to conclude that none of the racial proportions in commercials is a match to the census proportions.
O Fail to reject Ho. There is enough evidence to conclude that all of the racial proportions in commercials are a match to the census proportions.
Expert Solution
This question has been solved!
Explore an expertly crafted, step-by-step solution for a thorough understanding of key concepts.
Step by step
Solved in 2 steps with 1 images

Recommended textbooks for you

Glencoe Algebra 1, Student Edition, 9780079039897…
Algebra
ISBN:
9780079039897
Author:
Carter
Publisher:
McGraw Hill

Glencoe Algebra 1, Student Edition, 9780079039897…
Algebra
ISBN:
9780079039897
Author:
Carter
Publisher:
McGraw Hill