na job fair, 3000 applicants applied for a job. Their nean age was found to be 28 with a standard eviation of 4 years. .) draw a normal curve distribution showing the z cores and raw scores. .) Find the age such that 75% are below it. Normal curve in letter A is the normal curve for etter B).
na job fair, 3000 applicants applied for a job. Their nean age was found to be 28 with a standard eviation of 4 years. .) draw a normal curve distribution showing the z cores and raw scores. .) Find the age such that 75% are below it. Normal curve in letter A is the normal curve for etter B).

Glencoe Algebra 1, Student Edition, 9780079039897, 0079039898, 2018
18th Edition
ISBN:9780079039897
Author:Carter
Publisher:Carter
Chapter10: Statistics
Section10.4: Distributions Of Data
Problem 19PFA

Related questions
Question
100%
Please graph clearly and show you solution.
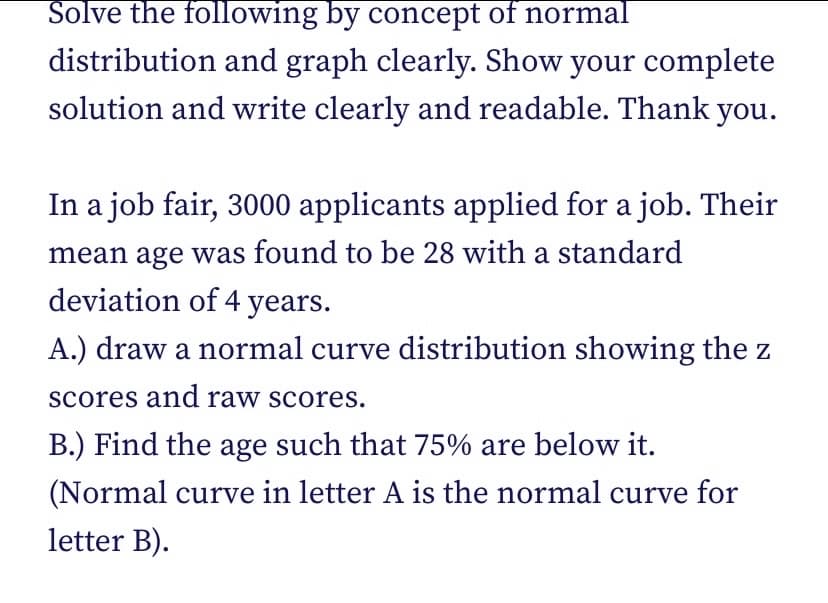
Transcribed Image Text:Solve the following by concept of normal
distribution and graph clearly. Show your complete
solution and write clearly and readable. Thank you.
In a job fair, 3000 applicants applied for a job. Their
mean age was found to be 28 with a standard
deviation of 4 years.
A.) draw a normal curve distribution showing the z
scores and raw scores.
B.) Find the age such that 75% are below it.
(Normal curve in letter A is the normal curve for
letter B).
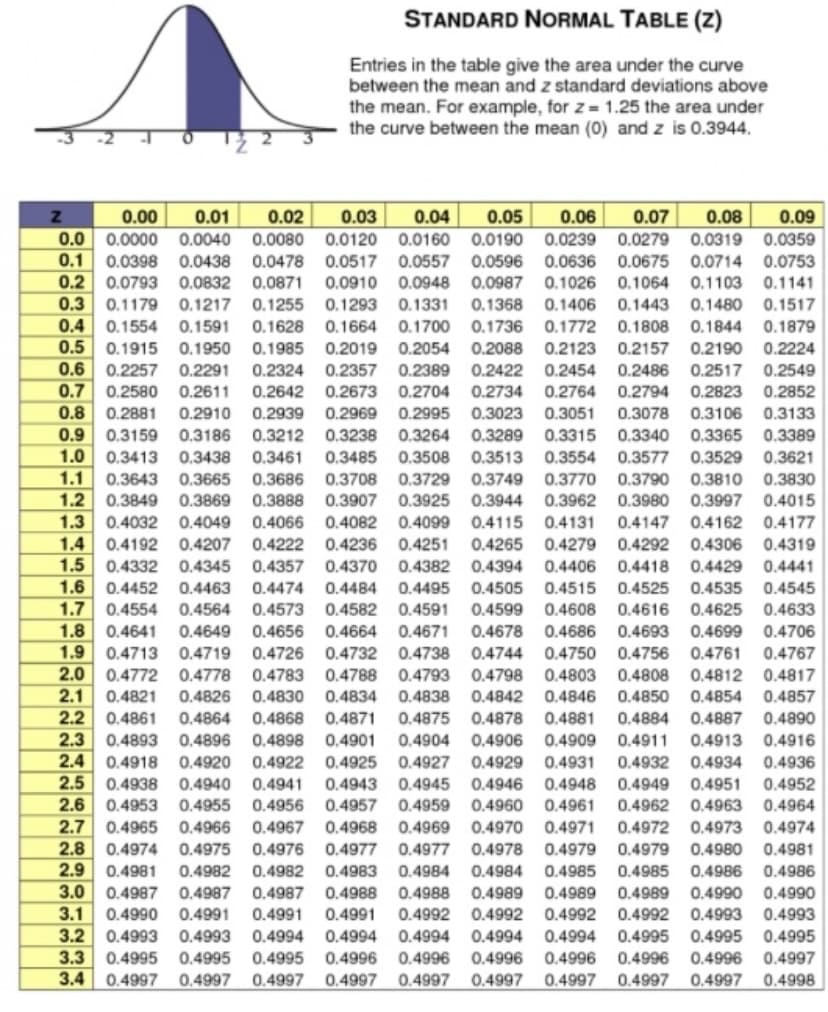
Transcribed Image Text:STANDARD NORMAL TABLE (Z)
Entries in the table give the area under the curve
between the mean and z standard deviations above
the mean. For example, for z = 1.25 the area under
the curve between the mean (0) and z is 0.3944.
0.00
0.01
0.02
0.03
0.04
0.05
0.06
0.07
0.08
0.09
0.0 0.0000
0.0040
0.0080
0.0120
0.0160
0.0190
0.0239 0.0279
0.0319 0.0359
0.0398
0.2 0.0793
0.3 0.1179
0.4 0.1554
0.1
0.0478 0.0517 0.0557
0.0871
0.1255
0.0438
0.0596
0.0636 0.0675
0.0714 0.0753
0.1103
0.1480
0.0832
0.0910
0.0948
0.0987
0.1026
0.1064
0.1141
0.1217
0.1293
0.1331
0.1368
0.1406 0.1443
0.1517
0.1700
0.2054
0.1879
0.2224
0.1591
0.1628
0.1664
0.1736
0.1772
0.1808
0.1844
0.5
0.1915
0.1950 0.1985
0.2019
0.2088
0.2123
0.2157
0.2190
0.6
0.2257
0.2291 0.2324 0.2357
0.2389
0.2422
0.2454
0.2486
0.2517
0.2549
0.7 0.2580
0.2611
0.2642
0.2673
0.2704
0.2734
0.2764
0.2794
0.2823
0.2852
0.8
0.2881
0.2910
0.2939
0.2969
0.2995
0.3023
0.3051
0.3078
0.3106
0.3133
0.9
1.0
0.3212 0.3238 0.3264
0.3461
0.3686
0.3186
0.3289
0.3340
0.3365 0.3389
0.3529
0.3159
0.3315
0.3413
0.3438
0.3485
0.3508
0.3513
0.3554
0.3577
0.3621
1.1
1.2
1.3
0.3643
0.3665
0.3708
0.3729
0.3749
0.3770
0.3790
0.3810
0.3830
0.3849
0.3869
0.3907
0.4082 0.4099
0.3888
0.3925
0.3944
0.3962
0.3980
0.3997
0.4015
0.4032
0.4049
0.4066
0.4115
0.4131
0.4147
0.4162
0.4177
1.4
0.4192
0.4207
0.4222
0.4236
0.4251
0.4265
0.4279
0.4292
0.4306
0.4319
1.5
0.4332
0.4345
0.4357
0.4370
0.4382
0.4394
0.4406
0.4418
0.4429
0.4441
1.6
1.7
1.8
0.4452
0.4463
0.4474
0.4484
0.4495
0.4505
0.4515
0.4525
0.4535
0.4545
0.4554
0.4641
0.4564
0.4573
0.4582
0.4591
0.4599
0.4608
0.4616
0.4625
0.4633
0.4649
0.4656
0.4664
0.4671
0.4678
0.4686
0.4693
0.4699
0.4706
1.9
2.0 0.4772
2.1
2.2 0.4861
0.4719
0.4778
0.4713
0.4726
0.4732
0.4738
0.4744
0.4750
0.4756 0.4761
0.4767
0.4783
0.4788
0.4793 0.4798
0.4842
0.4803
0.4808
0.4812
0.4817
0.4838
0.4875
0.4821
0.4826
0.4830
0.4834
0.4846
0.4850
0.4854
0.4857
0.4864
0.4868
0.4871
0.4878
0.4881
0.4884
0.4887 0.4890
2.3
2.4
2.5
0.4893
0.4918
0.4896
0.4898
0.4901
0.4904
0.4906
0.4909
0.4911
0.4913
0.4916
0.4920
0.4922
0.4925
0.4927
0.4929
0.4931
0.4932 0.4934
0.4936
0.4938
0.4953
0.4965
0.4941
0.4956
0.4940
0.4945
0.4959
0.4943
0.4946
0.4948
0.4949
0.4951
0.4952
2.6
0.4955
0.4966
0.4975
0.4957
0.4960
0.4961
0.4962
0.4963
0.4964
2.7
0.4967
0.4968
0.4969
0.4970
0.4971
0.4972 0.4973
0.4974
2.8
2.9
3.0
3.1
3.2
3.3 0.4995
3.4 0.4997
0.4974
0.4976
0.4977
0.4977
0.4978
0.4979
0.4979
0.4980
0.4981
0.4981
0.4982
0.4982
0.4983
0.4984
0.4984
0.4985
0.4985
0.4986
0.4986
0.4987
0.4987
0.4987
0.4988
0.4988
0.4989
0.4989
0.4989
0.4990
0.4990
0.4991
0.4991
0.4992
0.4994 0.4994
0.4990
0.4991
0.4992
0.4992
0.4992
0.4993
0.4993
0.4993
0.4995
0.4993
0.4994
0.4994
0.4994
0.4995
0.4995
0.4995
0.4995
0.4996
0.4996
0.4996
0.4996
0.4996
0.4996
0.4997
0.4997
0.4997 0.4997
0.4997
0.4997
0.4997
0.4997
0.4997
0.4998
Expert Solution
This question has been solved!
Explore an expertly crafted, step-by-step solution for a thorough understanding of key concepts.

Step by step
Solved in 3 steps with 2 images

Recommended textbooks for you
Glencoe Algebra 1, Student Edition, 9780079039897…
Algebra
ISBN:
9780079039897
Author:
Carter
Publisher:
McGraw Hill
Glencoe Algebra 1, Student Edition, 9780079039897…
Algebra
ISBN:
9780079039897
Author:
Carter
Publisher:
McGraw Hill