nation, which of the following statements is true? wer risk. ower risk.

A First Course in Probability (10th Edition)
10th Edition
ISBN:9780134753119
Author:Sheldon Ross
Publisher:Sheldon Ross
Chapter1: Combinatorial Analysis
Section: Chapter Questions
Problem 1.1P: a. How many different 7-place license plates are possible if the first 2 places are for letters and...

Related questions
Topic Video
Question
Transcribed Image Text:2. Statistical measures of stand-alone risk
Remember, the expected value of a probability distribution is a statistical measure of the average (mean) value expected to occur during a
possible circumstances. To compute an asset's expected return under a range of possible circumstances (or states of nature), multiply the
anticipated return expected to result during each state of nature by its probability of occurrence.
Consider the following case:
Ethan owns a two-stock portfolio that invests in Happy Dog Soap Company (HDS) and Black Sheep Broadcasting (BSB). Three-
quarters of Ethan's portfolio value consists of HDS's shares, and the balance consists of BSB's shares.
Each stock's expected return for the next year will depend on forecasted market conditions. The expected returns from the stocks
in different market conditions are detailed in the following table:
Market Condition
Probability of Occurrence
Happy Dog Soap
Black Sheep Broadcasting
Strong
0.50
50%
70%
Normal
0.25
30%
40%
Weak
0.25
-40%
-50%
Calculate expected returns for the individual stocks in Ethan's portfolio as well as the expected rate of return of the entire portfolio over the
three possible market conditions next year.
• The expected rate of return on Happy Dog Soap's stock over the next year is
• The expected rate of return on Black Sheep Broadcasting's stock over the next year is
• The expected rate of return on Ethan's portfolio over the next year is
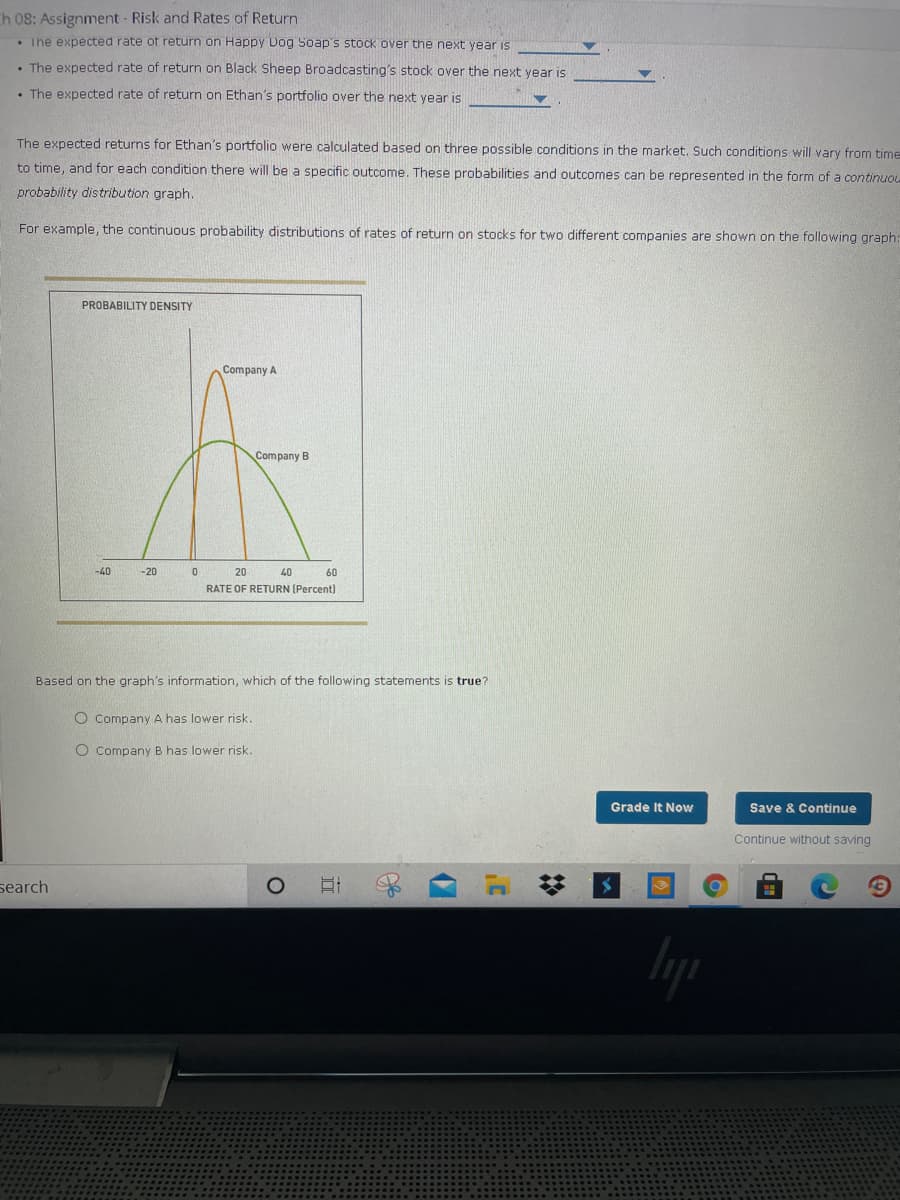
The expected returns for Ethan's portfolio were calculated based on three possible conditions in the market. Such conditions will vary from time
to time, and for each condition there will be a specific outcome. These probabilities and outcomes can be represented in the form of a continuou
probability distribution graph.
For example, the continuous probability distributions of rates of return on stocks for two different companies are shown on the following graph:
search
%23
Transcribed Image Text:Ch 08: Assignment Risk and Rates of Return
• The expected rate of return on Happy Dog Soap's stock over the next year is
• The expected rate of return on Black Sheep Broadcasting's stock over the next year is
• The expected rate of return on Ethan's portfolio over the next year is
The expected returns for Ethan's portfolio were calculated based on three possible conditions in the market. Such conditions will vary from time
to time, and for each condition there will be a specific outcome. These probabilities and outcomes can be represented in the form of a continuou
probability distribution graph.
For example, the continuous probability distributions of rates of return on stocks for two different companies are shown on the following graph:
PROBABILITY DENSITY
Company A
Company B
-40
-20
20
40
60
RATE OF RETURN (Percent)
Based on the graph's information, which of the following statements is true?
O Company A has lower risk.
O Company B has lower risk.
Grade It Now
Save & Continue
Continue without saving
search
(7
Expert Solution
This question has been solved!
Explore an expertly crafted, step-by-step solution for a thorough understanding of key concepts.

Step by step
Solved in 2 steps with 1 images

Knowledge Booster


Learn more about
Need a deep-dive on the concept behind this application? Look no further. Learn more about this topic, probability and related others by exploring similar questions and additional content below.Recommended textbooks for you
A First Course in Probability (10th Edition)
Probability
ISBN:
9780134753119
Author:
Sheldon Ross
Publisher:
PEARSON

A First Course in Probability (10th Edition)
Probability
ISBN:
9780134753119
Author:
Sheldon Ross
Publisher:
PEARSON