Need help with e through j please

Related questions
Question
Need help with e through j please
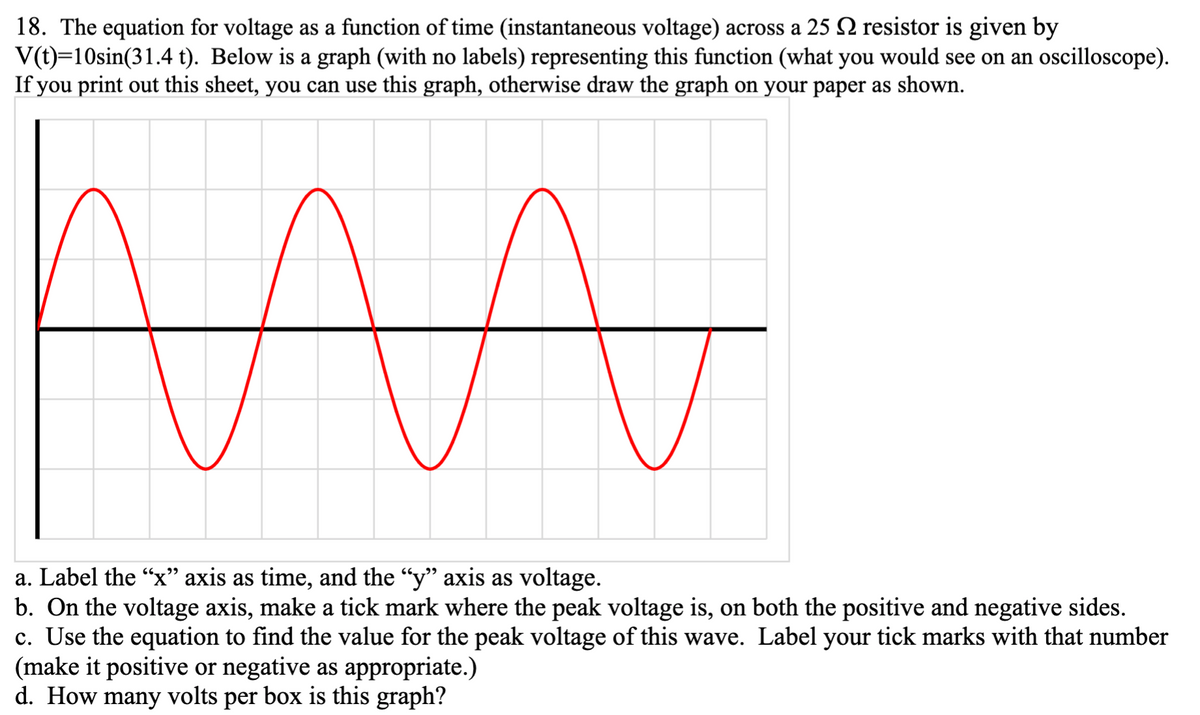
Transcribed Image Text:18. The equation for voltage as a function of time (instantaneous voltage) across a 25 2 resistor is given by
V(t)=10sin(31.4 t). Below is a graph (with no labels) representing this function (what you would see on an oscilloscope).
If you print out this sheet, you can use this graph, otherwise draw the graph on your paper as shown.
a. Label the “x" axis as time, and the “y" axis as voltage.
b. On the voltage axis, make a tick mark where the peak voltage is, on both the positive and negative sides.
c. Use the equation to find the value for the peak voltage of this wave. Label your tick marks with that number
(make it positive or negative as appropriate.)
d. How many volts per box is this graph?
![e. On the time axis, make a tick mark at the end of every period shown (starting the first period at t=0).
f. Use the equation to calculate the frequency (f, not angular frequency @) of this wave. [5 Hz]
g. Calculate the period of this wave. [0.2 s]
h. On the time axis, label each of your tick marks with the appropriate time using your calculated period.
i. How many seconds per box is this graph?
j. What is the rms voltage across the resistor? (what you would measure with a multimeter?) [7.07 V]](/v2/_next/image?url=https%3A%2F%2Fcontent.bartleby.com%2Fqna-images%2Fquestion%2F266e7f29-ba1d-4acb-9482-ffb76dbeef2e%2Fc1f652b8-7ce5-4180-ab78-e07e9f2edd56%2Fngbehu_processed.png&w=3840&q=75)
Transcribed Image Text:e. On the time axis, make a tick mark at the end of every period shown (starting the first period at t=0).
f. Use the equation to calculate the frequency (f, not angular frequency @) of this wave. [5 Hz]
g. Calculate the period of this wave. [0.2 s]
h. On the time axis, label each of your tick marks with the appropriate time using your calculated period.
i. How many seconds per box is this graph?
j. What is the rms voltage across the resistor? (what you would measure with a multimeter?) [7.07 V]
Expert Solution
This question has been solved!
Explore an expertly crafted, step-by-step solution for a thorough understanding of key concepts.

Step by step
Solved in 3 steps with 1 images
