Nêw Tab Which equation represents the graph shown below? y 600 550 500 450 400 350 300 250 200 150 100 50 -20 20 40 60 80 100 120 140 160 180 -50 -100 -150 9 0
Nêw Tab Which equation represents the graph shown below? y 600 550 500 450 400 350 300 250 200 150 100 50 -20 20 40 60 80 100 120 140 160 180 -50 -100 -150 9 0

Algebra & Trigonometry with Analytic Geometry
13th Edition
ISBN:9781133382119
Author:Swokowski
Publisher:Swokowski
Chapter11: Topics From Analytic Geometry
Section11.2: Ellipses
Problem 70E

Related questions
Question
Transcribed Image Text:A Student Progress Center
E DeltaMath
+
deltamath.com/student/solve/12693675/trigGraphsMatchMultipleChoice
pard | Kh..
The Role of Propag..
E Twelve Angry Men
K That as even the be.
O New Tab
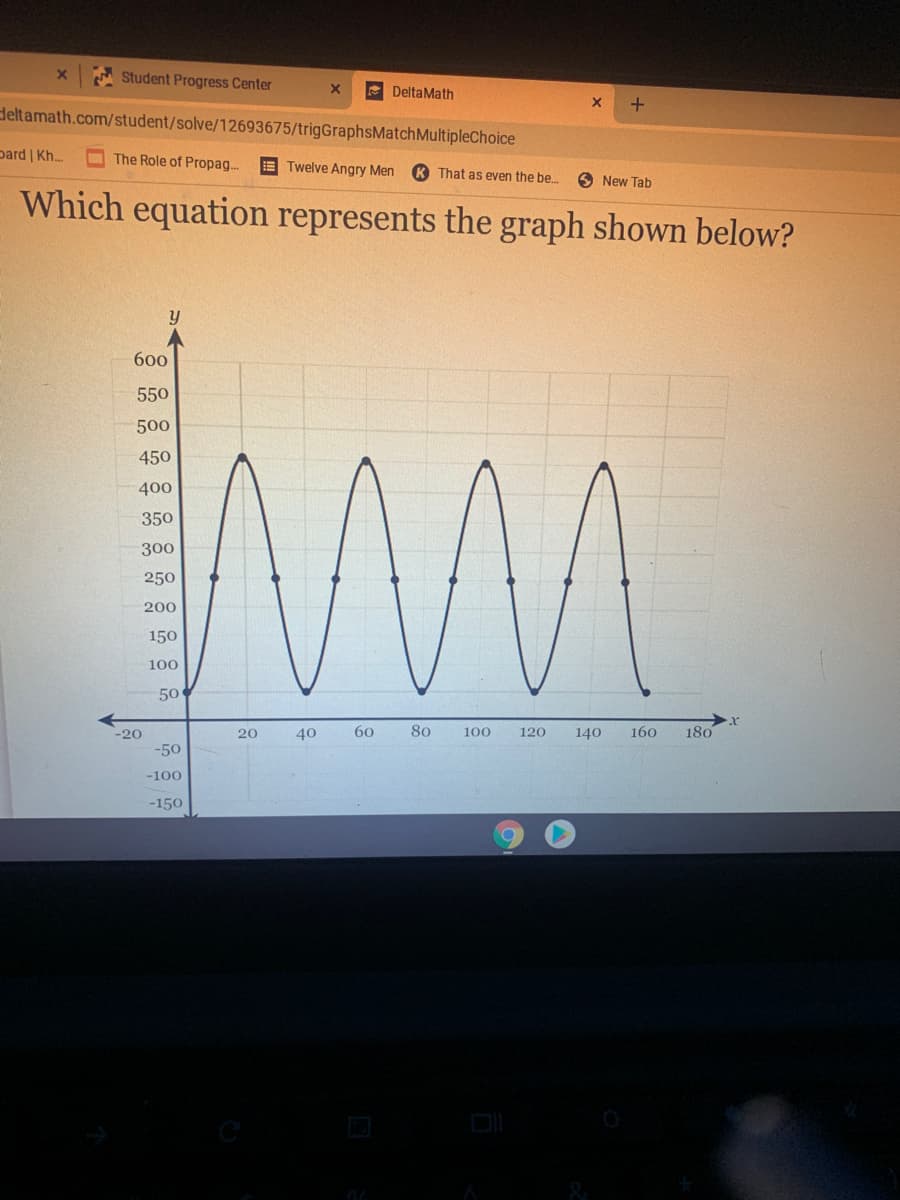
Which equation represents the graph shown below?
600
550
500
450
400
350
300
250
200
150
100
50
-20
20
40
60
80
100
120
140
160
180
-50
-100
-150
Expert Solution
This question has been solved!
Explore an expertly crafted, step-by-step solution for a thorough understanding of key concepts.

This is a popular solution!

Trending now
This is a popular solution!

Step by step
Solved in 2 steps with 2 images

Knowledge Booster


Learn more about
Need a deep-dive on the concept behind this application? Look no further. Learn more about this topic, algebra and related others by exploring similar questions and additional content below.Recommended textbooks for you
Algebra & Trigonometry with Analytic Geometry
Algebra
ISBN:
9781133382119
Author:
Swokowski
Publisher:
Cengage
Algebra & Trigonometry with Analytic Geometry
Algebra
ISBN:
9781133382119
Author:
Swokowski
Publisher:
Cengage