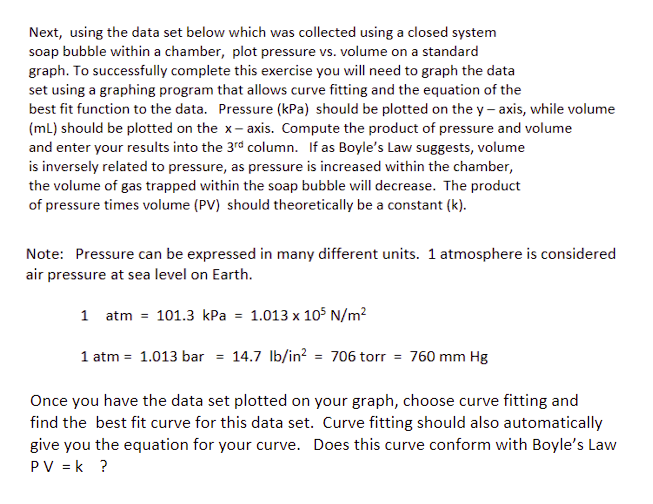
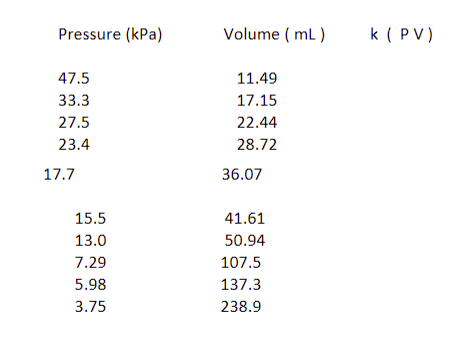
Next, using the data set below which was collected using a closed system soap bubble within a chamber, plot pressure vs. volume on a standard graph. To successfully complete this exercise you will need to graph the data set using a graphing program that allows curve fitting and the equation of the best fit function to the data. Pressure (kPa) should be plotted on the y-axis, while volume (ml) should be plotted on the x-axis. Compute the product of pressure and volume and enter your results into the 3rd column. If as Boyle's Law suggests, volume is inversely related to pressure, as pressure is increased within the chamber, the volume of gas trapped within the soap bubble will decrease. The product of pressure times volume (PV) should theoretically be a constant (k). Note: Pressure can be expressed in many different units. 1 atmosphere is considered air pressure at sea level on Earth. 1 atm = 101.3 kPa = 1.013 x 10⁵ N/m² 1 atm = 1.013 bar = 14.7 lb/in² = 706 torr = 760 mm Hg Once you have the data set plotted on your graph, choose curve fitting and find the best fit curve for this data set. Curve fitting should also automatically give you the equation for your curve. Does this curve conform with Boyle's Law PV = k ?
Next, using the data set below which was collected using a closed system soap bubble within a chamber, plot pressure vs. volume on a standard graph. To successfully complete this exercise you will need to graph the data set using a graphing program that allows curve fitting and the equation of the best fit function to the data. Pressure (kPa) should be plotted on the y-axis, while volume (ml) should be plotted on the x-axis. Compute the product of pressure and volume and enter your results into the 3rd column. If as Boyle's Law suggests, volume is inversely related to pressure, as pressure is increased within the chamber, the volume of gas trapped within the soap bubble will decrease. The product of pressure times volume (PV) should theoretically be a constant (k). Note: Pressure can be expressed in many different units. 1 atmosphere is considered air pressure at sea level on Earth. 1 atm = 101.3 kPa = 1.013 x 10⁵ N/m² 1 atm = 1.013 bar = 14.7 lb/in² = 706 torr = 760 mm Hg Once you have the data set plotted on your graph, choose curve fitting and find the best fit curve for this data set. Curve fitting should also automatically give you the equation for your curve. Does this curve conform with Boyle's Law PV = k ?

Principles of Heat Transfer (Activate Learning with these NEW titles from Engineering!)
8th Edition
ISBN:9781305387102
Author:Kreith, Frank; Manglik, Raj M.
Publisher:Kreith, Frank; Manglik, Raj M.
Chapter5: Analysis Of Convection Heat Transfer
Section: Chapter Questions
Problem 5.9P: When a sphere falls freely through a homogeneous fluid, it reaches a terminal velocity at which the...

Related questions
Question
Transcribed Image Text:Next, using the data set below which was collected using a closed system
soap bubble within a chamber, plot pressure vs. volume on a standard
graph. To successfully complete this exercise you will need to graph the data
set using a graphing program that allows curve fitting and the equation of the
best fit function to the data. Pressure (kPa) should be plotted on the y-axis, while volume
(ml) should be plotted on the x-axis. Compute the product of pressure and volume
and enter your results into the 3rd column. If as Boyle's Law suggests, volume
is inversely related to pressure, as pressure is increased within the chamber,
the volume of gas trapped within the soap bubble will decrease. The product
of pressure times volume (PV) should theoretically be a constant (k).
Note: Pressure can be expressed in many different units. 1 atmosphere is considered
air pressure at sea level on Earth.
1 atm = 101.3 kPa = 1.013 x 10⁵ N/m²
1 atm = 1.013 bar = 14.7 lb/in² = 706 torr = 760 mm Hg
Once you have the data set plotted on your graph, choose curve fitting and
find the best fit curve for this data set. Curve fitting should also automatically
give you the equation for your curve. Does this curve conform with Boyle's Law
PV = k ?
Transcribed Image Text:Pressure (kPa)
47.5
33.3
27.5
23.4
17.7
15.5
13.0
7.29
5.98
3.75
Volume (mL)
11.49
17.15
22.44
28.72
36.07
41.61
50.94
107.5
137.3
238.9
k (PV)
Expert Solution
This question has been solved!
Explore an expertly crafted, step-by-step solution for a thorough understanding of key concepts.

This is a popular solution!

Trending now
This is a popular solution!

Step by step
Solved in 2 steps with 1 images

Knowledge Booster


Learn more about
Need a deep-dive on the concept behind this application? Look no further. Learn more about this topic, mechanical-engineering and related others by exploring similar questions and additional content below.Recommended textbooks for you
Principles of Heat Transfer (Activate Learning wi…
Mechanical Engineering
ISBN:
9781305387102
Author:
Kreith, Frank; Manglik, Raj M.
Publisher:
Cengage Learning
Principles of Heat Transfer (Activate Learning wi…
Mechanical Engineering
ISBN:
9781305387102
Author:
Kreith, Frank; Manglik, Raj M.
Publisher:
Cengage Learning