Nikos Anastopoulos of EMPROSS Strategic IT Consultants, leads the development of a new football stadium. He developed the activities, durations, and predecessor relationships in the following table for delivering company valuations. Activity Predecessor Duration in Weeks A - 5 B - 3 C A, B 8 D C 3 E - 4 F E 10 G F 8 H E 18 I D 20 J D, G, I 7 K I 5 L H 10 6A. Draw the Network Diagram, and identify and discuss the project duration and the critical path using the following activity notation: the first pic: First: Draw the precedence diagram. Second: Using the notation given identify the duration of the project: you can type it. Third: identify the critical part and explain the critical path. Fourth: Explain your answer. This can be done by describing the process and the observations done once the answer has been found. 6B. Draw the project’s Gantt chart First: The project’s Gantt chart needs to be done. Second: Explain the Gantt chart by emphasizing the observations made. State your conclusions. this final part is just a repeat but making two varibles time smaller: 6C. Change the time of at least two activities that can reduce the overall project duration, draw the new critical path and the new Gantt chart. First: Repeat 6B by changing the task time of any 2 or 3 tasks that will result in a smaller project duration: Please note that if your able to not just terminal tasks (ending tasks) then its better. Second: identify the critical part and explain it. Explain if the critical path has changed and why? or why not? Third: Explain your answer for the new (shorter) project duration. This can be done by describing the process and the observations done once the answer has been found. Fourth: Draw the new project’s Gantt chart Fifth: Explain the Gantt chart by emphasizing the observations made. State your conclusions.


hello so i asked this question before to bartleby the guy gave me the answer but it was very long and i got confused in the end which part is which can you please the below thanks:
Nikos Anastopoulos of EMPROSS Strategic IT Consultants, leads the development of a new football stadium. He developed the activities, durations, and predecessor relationships in the following table for delivering company valuations.
|
Activity |
Predecessor |
Duration in Weeks |
|
A |
- |
5 |
|
B |
- |
3 |
|
C |
A, B |
8 |
|
D |
C |
3 |
|
E |
- |
4 |
|
F |
E |
10 |
|
G |
F |
8 |
|
H |
E |
18 |
|
I |
D |
20 |
|
J |
D, G, I |
7 |
|
K |
I |
5 |
|
L |
H |
10 |
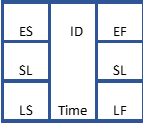
6A. Draw the Network Diagram, and identify and discuss the project duration and the critical path using the following activity notation:
the first pic:
First: Draw the precedence diagram.
Second: Using the notation given identify the duration of the project: you can type it.
Third: identify the critical part and explain the critical path.
Fourth: Explain your answer. This can be done by describing the process and the observations done once the answer has been found.
6B. Draw the project’s Gantt chart
First: The project’s Gantt chart needs to be done.
Second: Explain the Gantt chart by emphasizing the observations made. State your conclusions.
this final part is just a repeat but making two varibles time smaller:
6C. Change the time of at least two activities that can reduce the overall project duration, draw the new critical path and the new Gantt chart.
First: Repeat 6B by changing the task time of any 2 or 3 tasks that will result in a smaller project duration: Please note that if your able to not just terminal tasks (ending tasks) then its better.
Second: identify the critical part and explain it. Explain if the critical path has changed and why? or why not?
Third: Explain your answer for the new (shorter) project duration. This can be done by describing the process and the observations done once the answer has been found.
Fourth: Draw the new project’s Gantt chart
Fifth: Explain the Gantt chart by emphasizing the observations made. State your conclusions.

Step by step
Solved in 5 steps with 13 images


