NOAA/NOS/CO-OPS Observed Water Levels at 8729840, Pensacola FL From 2018/11/28 00:00 LST to 2018/11/29 23:59 LST 2.0 2.0 1.5 1.5 1.0 1.0 0.5 0.5 0.0 0.0 NOAA/NOS/Center for Operational Oceanographic Products and Services 20:00 11/28 00:00 04:00 08:00 12:00 16:00 00:00 04:00 08:00 12:00 16:00 20:00 11/28 11/28 11/28 11/28 11/28 11/29 11/29 11/29 11/29 11/29 11/29 - Predictions - Verified - Preliminary - (Observed - Predicted) NOAANOS/CO-OPS Observed Water Levels at 8720030, Fernandina Beach FL From 2018/11/28 00:00 LST to 2018/11/29 23:59 LST 8.0 8.0 6.0 6.0 4.0 4.0 2.0 2.0 0.0 0.0 NOAA/ NOS/Center for Operational Oceanographic Products and Services 00:00 11/28 04:00 11/28 20:00 11/28 00:00 11/29 04:00 11/29 08:00 12:00 16:00 08:00 12:00 16:00 20:00 11/28 11/28 11/28 11/29 11/29 11/29 11/29 - Predictions - Verified - Preliminary (Observed - Predicted) NOAANOS/CO-OPS Observed Water Levels at 8727520, Cedar Key FL From 2018/11/28 00:00 LST to 2018/11/29 23:59 LST 4.0 4.0 3.0 3.0 2.0 2.0 1.0 1.0 0.0 0.0 -1.0 -1.0 NOAA/NOS/Center for Operational Oceanographic Products and Services 04:00 11/28 08:00 11/28 12:00 11/28 20:00 11/28 00:00 11/29 04:00 11/29 08:00 11/29 00:00 16:00 12:00 16:00 20:00 11/28 11/28 11/29 11/29 11/29 - Predictions - Verified - Preliminary (Observed - Predicted) Height in feet (MLLW) Height in feet (MLLW) Height in feet (MLLW)
NOAA/NOS/CO-OPS Observed Water Levels at 8729840, Pensacola FL From 2018/11/28 00:00 LST to 2018/11/29 23:59 LST 2.0 2.0 1.5 1.5 1.0 1.0 0.5 0.5 0.0 0.0 NOAA/NOS/Center for Operational Oceanographic Products and Services 20:00 11/28 00:00 04:00 08:00 12:00 16:00 00:00 04:00 08:00 12:00 16:00 20:00 11/28 11/28 11/28 11/28 11/28 11/29 11/29 11/29 11/29 11/29 11/29 - Predictions - Verified - Preliminary - (Observed - Predicted) NOAANOS/CO-OPS Observed Water Levels at 8720030, Fernandina Beach FL From 2018/11/28 00:00 LST to 2018/11/29 23:59 LST 8.0 8.0 6.0 6.0 4.0 4.0 2.0 2.0 0.0 0.0 NOAA/ NOS/Center for Operational Oceanographic Products and Services 00:00 11/28 04:00 11/28 20:00 11/28 00:00 11/29 04:00 11/29 08:00 12:00 16:00 08:00 12:00 16:00 20:00 11/28 11/28 11/28 11/29 11/29 11/29 11/29 - Predictions - Verified - Preliminary (Observed - Predicted) NOAANOS/CO-OPS Observed Water Levels at 8727520, Cedar Key FL From 2018/11/28 00:00 LST to 2018/11/29 23:59 LST 4.0 4.0 3.0 3.0 2.0 2.0 1.0 1.0 0.0 0.0 -1.0 -1.0 NOAA/NOS/Center for Operational Oceanographic Products and Services 04:00 11/28 08:00 11/28 12:00 11/28 20:00 11/28 00:00 11/29 04:00 11/29 08:00 11/29 00:00 16:00 12:00 16:00 20:00 11/28 11/28 11/29 11/29 11/29 - Predictions - Verified - Preliminary (Observed - Predicted) Height in feet (MLLW) Height in feet (MLLW) Height in feet (MLLW)

Related questions
Question
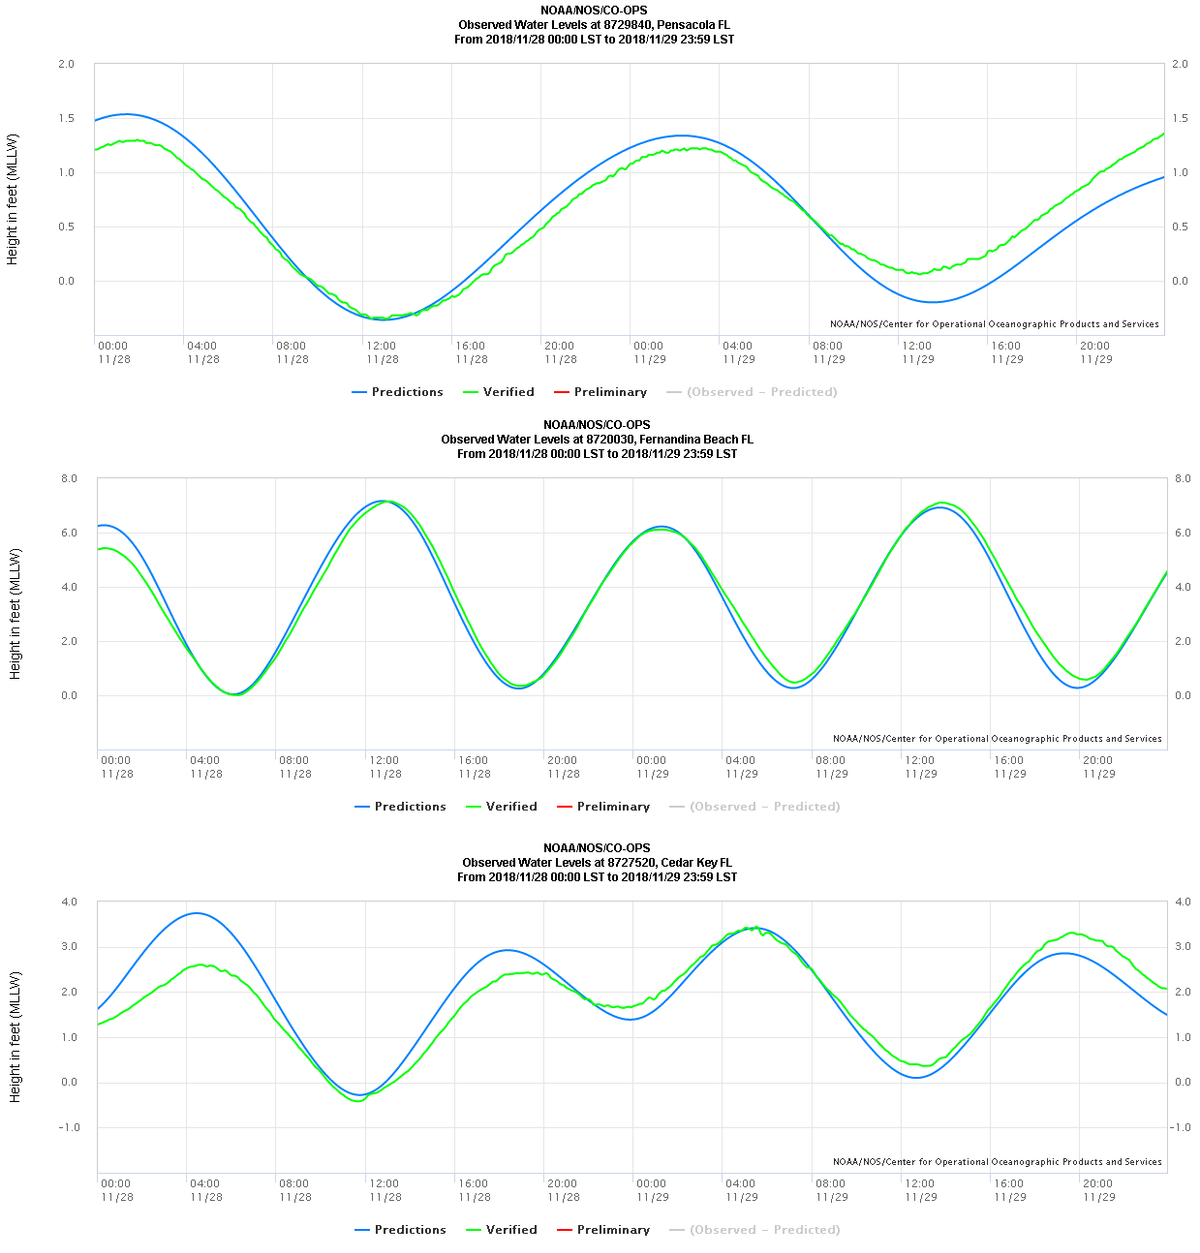
Based on the plotted predicted data for the two days, the vertical distance between the highest high tide and lowest low tide at Fernandina Beach was about ________ ft.
a.1.7
b.4.8
c.7.2
Transcribed Image Text:NOAA/NOS/CO-OPS
Observed Water Levels at 8729840, Pensacola FL
From 2018/11/28 00:00 LST to 2018/11/29 23:59 LST
2.0
2.0
1.5
1.5
1.0
1.0
0.5
0.5
0.0
0.0
NOAA/NOS/Center for Operational Oceanographic Products and Services
20:00
11/28
00:00
04:00
08:00
12:00
16:00
00:00
04:00
08:00
12:00
16:00
20:00
11/28
11/28
11/28
11/28
11/28
11/29
11/29
11/29
11/29
11/29
11/29
- Predictions
- Verified
- Preliminary
- (Observed - Predicted)
NOAANOS/CO-OPS
Observed Water Levels at 8720030, Fernandina Beach FL
From 2018/11/28 00:00 LST to 2018/11/29 23:59 LST
8.0
8.0
6.0
6.0
4.0
4.0
2.0
2.0
0.0
0.0
NOAA/ NOS/Center for Operational Oceanographic Products and Services
00:00
11/28
04:00
11/28
20:00
11/28
00:00
11/29
04:00
11/29
08:00
12:00
16:00
08:00
12:00
16:00
20:00
11/28
11/28
11/28
11/29
11/29
11/29
11/29
- Predictions
- Verified
- Preliminary
(Observed - Predicted)
NOAANOS/CO-OPS
Observed Water Levels at 8727520, Cedar Key FL
From 2018/11/28 00:00 LST to 2018/11/29 23:59 LST
4.0
4.0
3.0
3.0
2.0
2.0
1.0
1.0
0.0
0.0
-1.0
-1.0
NOAA/NOS/Center for Operational Oceanographic Products and Services
04:00
11/28
08:00
11/28
12:00
11/28
20:00
11/28
00:00
11/29
04:00
11/29
08:00
11/29
00:00
16:00
12:00
16:00
20:00
11/28
11/28
11/29
11/29
11/29
- Predictions
- Verified
- Preliminary
(Observed - Predicted)
Height in feet (MLLW)
Height in feet (MLLW)
Height in feet (MLLW)
Expert Solution
This question has been solved!
Explore an expertly crafted, step-by-step solution for a thorough understanding of key concepts.

This is a popular solution!

Trending now
This is a popular solution!

Step by step
Solved in 2 steps
