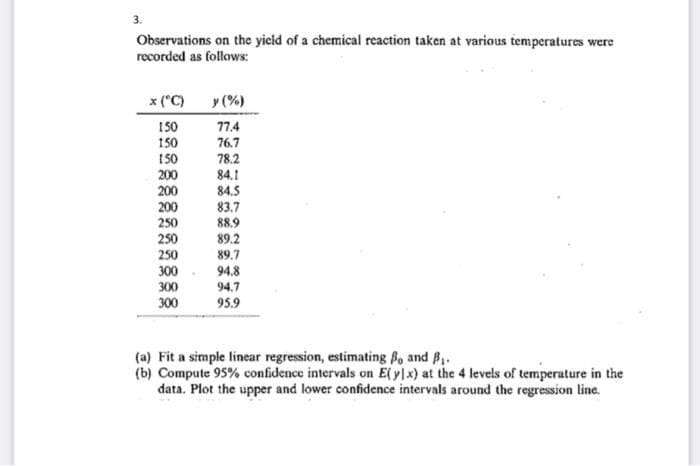
Observations on the yicld of a chemical reaction taken at various temperatures were recorded as follows:


Q: A 2³-2 design was used to investigate the effect of A = condensation temperature, B = amount of…
A: Since, you posted multiple questions, we will solve 3rd question for you.
Q: erence in receiving the signals from both stat ath where the ship experiences the same tir
A: Difference in distance between the ship and the two stations is given by: ∆d=c∆t Where ∆t is time…
Q: Source d.f SS MSS Between groups 2403.5 Within groups 942 205.1 Total 193204.2 2403.5 Cannot find
A: Given: df=942MSS=205.1 We know that the formula of MSS is: MSS=SSwithindf We need to find SSwithin.
Q: 1254. A square plate of side a has one side maintained at temperature f(z) and the others at zero,…
A:
Q: During the design of the spring-support system for the m, = 3590 kg weighing platform, it is decided…
A:
Q: f(in rad /s) = 6.283 rad /s Calculate the natural frequency of the system. fn= 1 Hz √1-0.075² fn =…
A: Given question:- for step 3 after the simplify steps how the answer ended up being k = 992.5434 N/m?
Q: The current I(t) in an LC series circuit is governed by the initial value problem below. Determine…
A: In this question, we solve the initial value problem by using the Laplace transform and properties…
Q: QUESTION 11 Let X denote the time to failure (in years) of a certain hydraulic component. Suppose…
A:
Q: 1. Compute E(1/X) 2. Find the cdf and the pdf of Y = 1/X 3. Compute E(Y) and compare this result…
A:
Q: Evaluate in terms of gamma function: x°e-3¤ dx O r(7) Or(17) O(7) OI(7)
A:
Q: S (s3 +1)lns ds
A:
Q: 3) Suppose the joint pdf of lifetimes of a certain part and spare is given by f(x,y) = {e**), 0 < x…
A: Hello! As you have posted more than 3 sub parts, we are answering the first 3 sub-parts. In case…
Q: In the article “Measurements of the Thermal Conductivity and Thermal Diffusivity of Polymer Melts…
A:
Q: Let H(t) denote the Heaviside step function. Find (a) L[H(t – 1/2) cos t]
A: As per the guidelines I am supposed to do the first question only. Kindly repost the other questions…
Q: The article "Measurements of the Thermal Conductivity and Thermal Diffusivity of Polymer Melts with…
A: Hi, thanks for the question. Since there are multiple subparts posted, we will answer only the first…
Q: l'Hôpital's Rule
A: Given equation
Q: In the diagram, KL = NR and JL MR. What additional information is needed to show AJKL = AMNR by SAS?
A: Given△JKL and △MNR
Q: The heat capacity of a gas is tabulated at series of temperatures: TCO 20 50 80 110 Cp J/mol.C 28.95…
A: We have to calculate the values of heat capacity corresponding to 28 C° and 93 C° using the newton…
Q: Exercise 3
A:
Q: A coil of inductance of 3H and a resistance of 200 is connected with an emf E =220sin3ot, where t is…
A: We will find out the required value.
Q: In Exercises 5-12, calculate MN and TN for the value of N indicated.
A: Given ∫141xdx, N=6
Q: Find the critical value, tc for c = 0.99 and n = 10
A: Given: n = 10 degree of freedom = n-1 = 10-1 = 9 Confidence interval = 99% = 0.99
Q: SAS HL None of the above. SSA CLEAR ALL
A:
Q: Solve the following. Additionally, comment on the behavior of the solu- tion(s) as t → 00.
A:
Q: / (3cosh m 2 cosh m sinh mdm +e°
A:
Q: Consider the model y, , + e, where for X= {r1,…..,¤N}, and for all i, E (e|X) = c # 0. and Var (eX)…
A: From the given information, yi=γxi+ei X=x1, x2, ...., XN Eei|X=c≠0 Varei|X=σ2 Here, the ols…
Q: Find the critical value, ta/2 for c=0.99 and n=10
A: We have to find critical value ...
Q: The article "Enthalpies and Entropies of Transfer of Electrolytes and Ions from Water to Mixed…
A: Enter the given data in EXCEL sheet and create the variables x2 and x3 as shown below:
Q: Question 4. Show that the average value of f(x) ei. = e- + cos x on the interval [-7/2,0] is
A:
Q: Solve An article in the ASCE Journal of Energy Engineering (1999, Vol. 125, pp.59-75) describes…
A: Given Information: sample size (n)=05Sample space={23.01, 22.22, 22.04, 22.62, 22.59}α=0.05
Q: Question # 5: Member ABC is supported by a smooth collar at A, roller at B, and short link CD.…
A:
Q: (10) The ifctime 7 of a device has pdf astsa+To fr(t) = To otherwise A. Determine R(t) and MTTF of…
A: Given The lifetime T of a device has pdf Find Determine R(t) and MTTF of the devices Determine the…
Q: An experiment has been conducted to investigate the effects of carbon monoxide in the breathing…
A: a) In this context, it is appropriate to use paired t test. Let 'd' is the difference between with…
Q: Find the average power of the signal: x(t) : = cos x + sin x (-7/4, 0) (7n/4, 0)
A: From the given graph, it is observed that the period of function is T0=7π4--π4=2π. Compute the…
Q: Fix each of the following statements regarding reversible processes. a) For a reversible process,…
A:
Q: Q6: When the input to a given system audio is (4 cos 800 at + cos 2000nt)mv, the measured frequency…
A: Given that ei=4 cos 800πt+cos 2000 πt Frequency = 600 kHz V = 1 mv e0=a1ei+a2ei2 ----(1) To…
Q: To illustrate calculations with the unit impulse function, consider evaluation of the following…
A: Since you have asked multiple questions, we can solve first question for you. If you want other…
Q: QUESTION 12 What is Cov[z,,2,l for the following AR(1) model, where e- N (0,0.32), =0.4-0.32,-1…
A:
Q: dz and ду dz Find z = a° In (1+ cy) az dz ду ||
A:
Q: 1.12. Calculate the 1000 to 500 hPa thickness for isothermal conditions with temperatures of 273 and…
A: To Calculate the 1000 to 500 hPa thickness for isothermal conditions with temperatures of 273 and…
Q: Evaluate (a) by using beta function ∞ ∫ √xe−xdx 0
A:
Q: Sheet 4 Numerical analysis dx QI/ Evaluate Jo 1+x2 Simpson's 1/3 rule Simpson's 3/8 rule i- ii-
A: In the question we have to find value of integrals.
Q: The Beer-Lambert law relates the absorbance A of a solution to the concentration C of a species in…
A:
Q: Use the Simpson's 1/3 rule with n = 8 to estimate: cosx
A:
Q: Differentiate the function
A: Recall the following facts on differentiation.
Q: e: ZN ZP
A: Given: MN¯≅MP¯, NO¯≅PO¯ To prove: ∠N≅∠P
Q: Using the Method of Undetermined Coefficients, a suitable choice for the nonhomogeneous salution y,…
A:


Trending now
This is a popular solution!

Step by step
Solved in 4 steps with 6 images

- The following fictitious table shows kryptonite price, in dollar per gram, t years after 2006. t= Years since 2006 0 1 2 3 4 5 6 7 8 9 10 K= Price 56 51 50 55 58 52 45 43 44 48 51 Make a quartic model of these data. Round the regression parameters to two decimal places.Olympic Pole Vault The graph in Figure 7 indicates that in recent years the winning Olympic men’s pole vault height has fallen below the value predicted by the regression line in Example 2. This might have occurred because when the pole vault was a new event there was much room for improvement in vaulters’ performances, whereas now even the best training can produce only incremental advances. Let’s see whether concentrating on more recent results gives a better predictor of future records. (a) Use the data in Table 2 (page 176) to complete the table of winning pole vault heights shown in the margin. (Note that we are using x=0 to correspond to the year 1972, where this restricted data set begins.) (b) Find the regression line for the data in part ‚(a). (c) Plot the data and the regression line on the same axes. Does the regression line seem to provide a good model for the data? (d) What does the regression line predict as the winning pole vault height for the 2012 Olympics? Compare this predicted value to the actual 2012 winning height of 5.97 m, as described on page 177. Has this new regression line provided a better prediction than the line in Example 2?You have obtained a sub-sample of 1744 individuals from the Current Population Survey (CPS) and are interested in the relationship between weekly earnings and age. The regression, using heteroskedasticity-robust standard errors, yielded the following result: = 239.16 + 3.75× Age, R2 = 0.15, SER = 287.21., where Earn and Age are measured in dollars and years respectively. Interpret the intercept? Interpret the slope coefficient b) Is the effect of age on earnings large? The average age in this sample is 37.5 years. What is annual income in the sample? (e) Interpret the measures of fit.
- A researcher notes that, in a certain region, a disproportionate number of software millionaires were born around the year 1955. Is this a coincidence, or does birth year matter when gauging whether a software founder will besuccessful? The researcher investigated this question by analyzing the data shown in the accompanying table. Complete parts a through c below. a. Find the coefficient of determination for the simple linear regression model relating number (y) of software millionaire birthdays in a decade to total number (x) of births in the region. Interpret the result. The coefficient of determination is 1.___? (Round to three decimal places as needed.) This value indicates that 2.____ of the sample variation in the number of software millionaire birthdays is explained by the linear relationship with the total number of births in the region. (Round to one decimal place as needed.) b. Find the coefficient of determination for the simple linear regression model…2. The following data, adapted from Montgomery, Peck, and Vining (2001), present the number of certified mental defectives per 10,000 of estimated population in the United Kingdom ( y) and the number of radio receiver licenses issued (x) by the BBC (in millions) for the years 1924 through 1937. Fit a regression model relating y and x. Comment on the model. Specifically, does the existence of a strong correlation imply a cause-and-effect relationship?We wish to estimate the effect of weight on serum cholesterol (S. C.) level in healthy females aged between 20 and 25. To estimate the regression equation of S.C. level on weight, a random sample of 10 females in this age class was taken, with the following results: a. Compute (beta) B^ 1 the estimate of the slope coefficient b. Compute (beta) B^ 0 the estimate of the intercept person# 1 2 3 4 5 6 7 8 9 10 X 53.7 56.8 54.1 54.4 55.1 55.8 56.3 57.1 56.6 57.6 Y 124.8 126.2 125.7 125.1 126.5 124.6 126.4 127.8 127.3 127.4
- Shown below is a portion of a computer output for a linear regression analysis relating an individual's income (y in thousands of dollars) to age (x1 in years), level of education (x2 ranging from 1 to 5), and the individual's gender (x3 where 0 = female and 1 = male). Coefficient Standard Error t-statistic p-value Intercept 15.934 1.389 11.47 0.000 x1 0.625 0.094 6.65 0.000 x2 0.921 0.190 4.85 0.000 x3 –0.510 0.920 –0.55 0.590 Source of Variation Sum of squares Degrees of freedom Mean square F-statistic p-value Regression 84 3 28 4 0.027 Error 112 16 7 Total 196 19 a. Is there a significant relationship between an individual's income and the set of variables, age, level of education, and gender (based on a significance level α =05 )? Explain why using one of the p-values in the output tables. b.Which of the three predictor variables are…The following estimated regression model was developed relating yearly income (y in $1000s) of 30 individuals with their age (x1) and their gender (x2) (0 if male and 1 if female).ŷ = 30 + 0.7x1 + 3x2Also provided are SST = 1200 and SSE = 384.The yearly income of a 24-year-old female individual is _____.Consider a linear regression model for the decrease in blood pressure (mmHg) over a four-week period with muy=2.8+0.8x and standard deviation chi=3.2. The explanatory variable x is the number of servings fruits and vegetables in a calorie-controlled diet. Using the 68-95-99.7 rule, between what two values would approximately 95% of the observed responses, y, fall when x = 7?
- 6.6 You estimated a regression with the following output. Source | SS df MS Number of obs = 209 -------------+---------------------------------- F(1, 207) = 92470.91 Model | 622579639 1 622579639 Prob > F = 0.0000 Residual | 1393670.56 207 6732.70804 R-squared = 0.9978 -------------+---------------------------------- Adj R-squared = 0.9978 Total | 623973310 208 2999871.68 Root MSE = 82.053 ------------------------------------------------------------------------------ Y | Coef. Std. Err. t P>|t| [95% Conf. Interval] -------------+---------------------------------------------------------------- X | 34.2537 .1126432 304.09 0.000 34.03163 34.47578 _cons | 8.806569 10.31802 0.85 0.394 -11.5353 29.14844…The following table shows the annual number of PhD graduates in a country in various fields. NaturalSciences Engineering SocialSciences Education 1990 70 10 60 30 1995 130 40 120 50 2000 330 130 280 140 2005 490 370 460 210 2010 590 550 830 520 2012 690 590 1,000 900 (a) With x = the number of social science doctorates and y = the number of education doctorates, use technology to obtain the regression equation. (Round coefficients to three significant digits.) y(x) = Graph the associated points and regression line. (b) What does the slope tell you about the relationship between the number of social science doctorates and the number of education doctorates? The slope tells us the increase in the number of education doctorates for each additional social science doctorate.The slope tells us the decrease in the number of education doctorates for each additional social science doctorate. The slope tells us the increase in the number…The following table shows the annual number of PhD graduates in a country in various fields. NaturalSciences Engineering SocialSciences Education 1990 70 10 70 30 1995 130 40 110 50 2000 330 130 280 140 2005 490 370 460 210 2010 590 550 830 520 2012 690 590 1,000 900 (a) With x = the number of social science doctorates and y = the number of education doctorates, use technology to obtain the regression equation. (Round coefficients to three significant digits.) y(x) = Graph the associated points and regression line. (b) What does the slope tell you about the relationship between the number of social science doctorates and the number of education doctorates? The slope tells us the increase in the number of social science doctorates for each additional education doctorate.The slope tells us the increase in the number of education doctorates for each additional social science doctorate. The slope tells us the decrease in the number…

