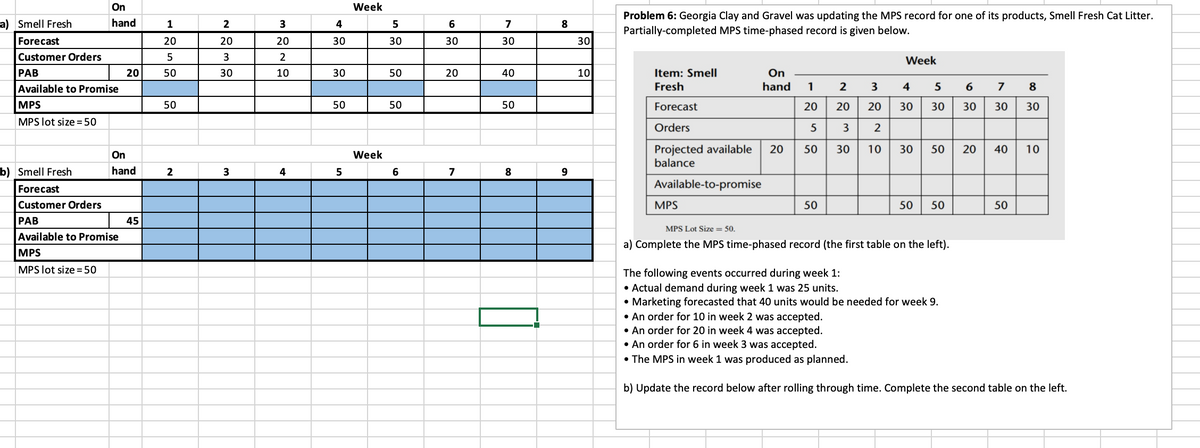
On Week a) Smell Fresh hand 1 2 Forecast 20 20 PAB Customer Orders Available to Promise 5 3 20 50 30 3222 4 5 6 7 8 Problem 6: Georgia Clay and Gravel was updating the MPS record for one of its products, Smell Fresh Cat Litter. Partially-completed MPS time-phased record is given below. 20 30 30 30 30 30 Week 10 30 50 20 40 10 Item: Smell Fresh On hand 1 2 3 4 5 6 7 8 MPS MPS lot size=50 50 50 50 50 g| Forecast 20 20 Orders 5 20 50 233 220 20 20 30 30 30 30 30 On Week b) Smell Fresh hand 2 3 4 5 6 7 8 9 Forecast Customer Orders PAB Available to Promise MPS MPS lot size=50 45 Projected available balance Available-to-promise MPS MPS Lot Size = 50. 50 10 30 50 50 50 a) Complete the MPS time-phased record (the first table on the left). The following events occurred during week 1: • Actual demand during week 1 was 25 units. • Marketing forecasted that 40 units would be needed for week 9. An order for 10 in week 2 was accepted. An order for 20 in week 4 was accepted. • An order for 6 in week 3 was accepted. • The MPS in week 1 was produced as planned. 40 20 40 20 50 10 10 b) Update the record below after rolling through time. Complete the second table on the left.


Problem 6 Part A:
Available to promise in period 4 = 50
Problem 6 Part B:
PAB in period 7 = 35
In part A, the only thing that you need to do is to calculate the ATP in periods 1,4,5, and 7.
In part B, remember that you are rolling through time. The part B solution spreadsheet starts with time period 2 and period 1 is now history. For the part B, you must capture all of the events that occurred during week 1. For example, I gave you that the beginning PAB is 45. If you had 20 in stock (from part A), you produced 50 as planned in period 1, and the actual demand for period 1 was 25, then the beginning PAB (your stock quantity) is 20+50-25=45. The


Trending now
This is a popular solution!

Step by step
Solved in 2 steps


