P2.28 A multiple-loop model of an urban ecological system might include the following variables: number of people in the city (P), modernization (M), migration into the city (C), sanitation facilities (S), number of diseases (D), bacteria/area (B), and amount of garbage/area (G), where the symbol for the variable is given in parentheses. The following causal loops are hypothesized: 1. P → G → B → D → P 2. Р — М —С +Р 3. Р — М —S D+P 4. P → M → S → B → D →P Sketch a signal-flow graph for these causal relationships, using appropriate gain symbols. Indicate whether you believe each gain transmission is positive or - negative. For example, the causal link S to B is negative because improved sanitation facilities lead to reduced bacteria/area. Which of the four loops are positive feedback loops and which are negative feedback loops?
P2.28 A multiple-loop model of an urban ecological system might include the following variables: number of people in the city (P), modernization (M), migration into the city (C), sanitation facilities (S), number of diseases (D), bacteria/area (B), and amount of garbage/area (G), where the symbol for the variable is given in parentheses. The following causal loops are hypothesized: 1. P → G → B → D → P 2. Р — М —С +Р 3. Р — М —S D+P 4. P → M → S → B → D →P Sketch a signal-flow graph for these causal relationships, using appropriate gain symbols. Indicate whether you believe each gain transmission is positive or - negative. For example, the causal link S to B is negative because improved sanitation facilities lead to reduced bacteria/area. Which of the four loops are positive feedback loops and which are negative feedback loops?

Chapter29: Service-entrance Calculations
Section: Chapter Questions
Problem 3R: a. What is the ampere rating of the circuits that are provided for the small-appliance loads? _____...

Related questions

Question
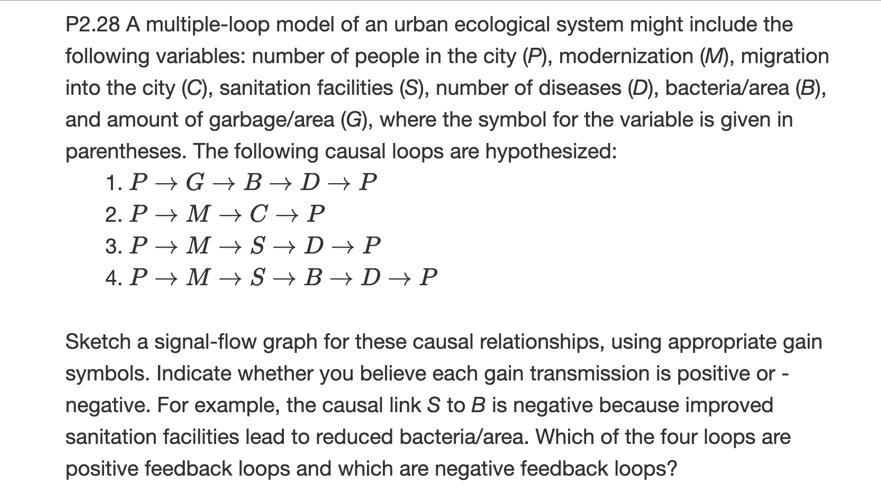
Transcribed Image Text:P2.28 A multiple-loop model of an urban ecological system might include the
following variables: number of people in the city (P), modernization (M), migration
into the city (C), sanitation facilities (S), number of diseases (D), bacteria/area (B),
and amount of garbage/area (G), where the symbol for the variable is given in
parentheses. The following causal loops are hypothesized:
1. P → G → B → D → P
2. Р — М —С + Р
3. Р — М —S + D-> P
4. Р > М —S> В — D-Р
Sketch a signal-flow graph for these causal relationships, using appropriate gain
symbols. Indicate whether you believe each gain transmission is positive or -
negative. For example, the causal link S to B is negative because improved
sanitation facilities lead to reduced bacteria/area. Which of the four loops are
positive feedback loops and which are negative feedback loops?
Expert Solution
Step 1
For the above-given data
The signal flow graph is drawn as shown below

Trending now
This is a popular solution!

Step by step
Solved in 2 steps with 3 images

Knowledge Booster


Learn more about
Need a deep-dive on the concept behind this application? Look no further. Learn more about this topic, electrical-engineering and related others by exploring similar questions and additional content below.Recommended textbooks for you
EBK ELECTRICAL WIRING RESIDENTIAL
Electrical Engineering
ISBN:
9781337516549
Author:
Simmons
Publisher:
CENGAGE LEARNING - CONSIGNMENT
EBK ELECTRICAL WIRING RESIDENTIAL
Electrical Engineering
ISBN:
9781337516549
Author:
Simmons
Publisher:
CENGAGE LEARNING - CONSIGNMENT