Part 2: The graph below represents the relative frequency of 4's that occur (number of 4's divided by the total num of rolls) versus the number of times the die was rolled for the first 1000 rolls. The table shows these values, and in addition, the total number of 4's for the 591st to 600th rolls. Use this information to answer the questions below. Long Term Relative Frequency 0.9- 0.8- 0.7 0.6 - 0.5 0.4 0.3 0.2 ive Frequency of '4° -9 00 765 +32-
Part 2: The graph below represents the relative frequency of 4's that occur (number of 4's divided by the total num of rolls) versus the number of times the die was rolled for the first 1000 rolls. The table shows these values, and in addition, the total number of 4's for the 591st to 600th rolls. Use this information to answer the questions below. Long Term Relative Frequency 0.9- 0.8- 0.7 0.6 - 0.5 0.4 0.3 0.2 ive Frequency of '4° -9 00 765 +32-

Glencoe Algebra 1, Student Edition, 9780079039897, 0079039898, 2018
18th Edition
ISBN:9780079039897
Author:Carter
Publisher:Carter
Chapter4: Equations Of Linear Functions
Section4.5: Correlation And Causation
Problem 15PPS

Related questions
Question
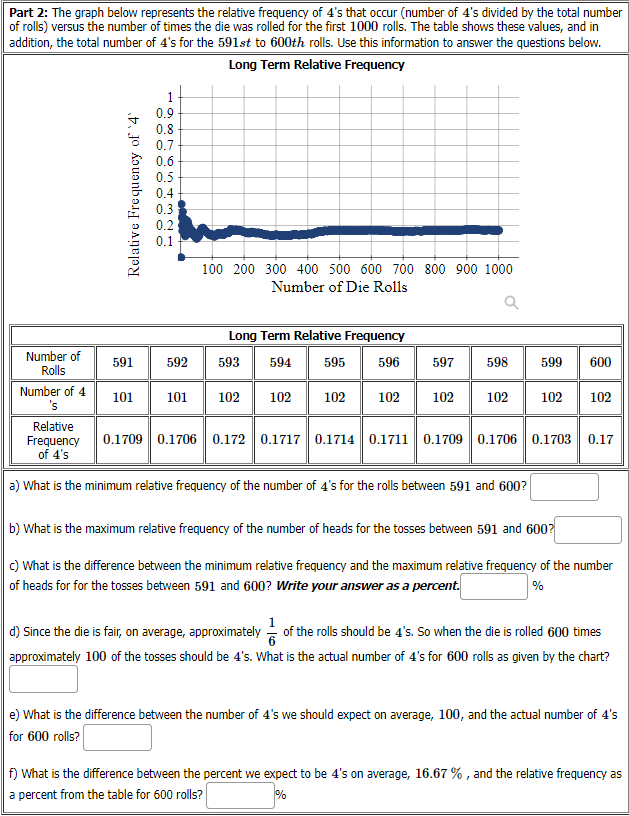
Transcribed Image Text:Part 2: The graph below represents the relative frequency of 4's that occur (number of 4's divided by the total number
of rolls) versus the number of times the die was rolled for the first 1000 rolls. The table shows these values, and in
addition, the total number of 4's for the 591st to 600th rolls. Use this information to answer the questions below.
Long Term Relative Frequency
0.9
0.8
0.7
0.6
0.5
0.4-
0.3
0.2
0.1
100 200 300 400 500 600 700 800 900 1000
Number of Die Rolls
Long Term Relative Frequency
Number of
Rolls
591
592
593
594
595
596
597
598
599
600
Number of 4
's
101
101
102
102
102
102
102
102
102
102
Relative
Frequency
of 4's
0.1709 0.1706 0.172 0.1717 0.1714 0.1711 0.1709 0.1706 0.1703
0.17
a) What is the minimum relative frequency of the number of 4's for the rolls between 591 and 600?
b) What is the maximum relative frequency of the number of heads for the tosses between 591 and 600?
c) What is the difference between the minimum relative frequency and the maximum relative frequency of the number
of heads for for the tosses between 591 and 600? Write your answer as a percent.
%
1
d) Since the die is fair, on average, approximately - of the rolls should be 4's. So when the die is rolled 600 times
approximately 100 of the tosses should be 4's. What is the actual number of 4's for 600 rlls as given by the chart?
e) What is the difference between the number of 4's we should expect on average, 100, and the actual number of 4's
for 600 rolls?
f) What is the difference between the percent we expect to be 4's on average, 16.67 % , and the relative frequency as
a percent from the table for 600 rolls?
%
Relative Frequency of '4
- o co 765 tm21
Expert Solution
This question has been solved!
Explore an expertly crafted, step-by-step solution for a thorough understanding of key concepts.

Step by step
Solved in 2 steps

Recommended textbooks for you
Glencoe Algebra 1, Student Edition, 9780079039897…
Algebra
ISBN:
9780079039897
Author:
Carter
Publisher:
McGraw Hill

Linear Algebra: A Modern Introduction
Algebra
ISBN:
9781285463247
Author:
David Poole
Publisher:
Cengage Learning

Glencoe Algebra 1, Student Edition, 9780079039897…
Algebra
ISBN:
9780079039897
Author:
Carter
Publisher:
McGraw Hill
Linear Algebra: A Modern Introduction
Algebra
ISBN:
9781285463247
Author:
David Poole
Publisher:
Cengage Learning

Big Ideas Math A Bridge To Success Algebra 1: Stu…
Algebra
ISBN:
9781680331141
Author:
HOUGHTON MIFFLIN HARCOURT
Publisher:
Houghton Mifflin Harcourt

Algebra: Structure And Method, Book 1
Algebra
ISBN:
9780395977224
Author:
Richard G. Brown, Mary P. Dolciani, Robert H. Sorgenfrey, William L. Cole
Publisher:
McDougal Littell