Part 3. Exploring Earthquake Magnitudes with technology Open the Earthquakes data set Canvas. Select a simple random sample of size 30. Scan the QR code to the right or click the link below for a step-by-step tutorial on selecting a simple random sample using StatCrunch. https://youtu.be/7jGJ2tG-doo ● ● ● ● Find the mean and standard deviation of magnitude of the earthquakes in your sample Min = ● X = 2.726 Find the five number summary of the magnitudes of the earthquakes in your sample Q₁ = Q3 2.82 2.5 Compute the following: S=0,28367782 0,26 IQR= 2.56 Q₂ = 2.665 we can use the interquattile range (IQR) method for identifying outliers. -0,3224 = Max = IQR 1.5 x IQR = IQR+ 1.5 x IQR = 0.4576 During the 1989 world series, a 6.9 magnitude earthquake struck the bay area.¹ In the context of the magnitudes considered here, is this magnitude an outlier? Explain why or why not. To determine if the magnitude of 6.9 from the 1989 world series earthquake is an outlier or not, Lower fence = Q1 - 1.5 x IQR Upper fence = Q3 +1.5 x IQR Substituting the given values, we get: Lower fence = 2.56 1.5 x 0.26 = 2.17 3.97 The IQR is 0.26, as given in the problem Upper fence = 2.82 + 1.5 x 0.26 = 3.21 statement. To find the fences for outlier detection, we can use the following formulas: Since the magnitude of the earthquake (6.9) is well beyond the upper fence (3.21), it is indeed an outlier. California's Great ShakeOut drill is based on a scenario involving a magnitude 7.8 earthquake.² In the context of the magnitudes considered here, is this magnitude an outlier? Explain why or why not. Upload your sample to this Canvas assignment as either a .SCS file, CSV file, or Excel format file.
Part 3. Exploring Earthquake Magnitudes with technology Open the Earthquakes data set Canvas. Select a simple random sample of size 30. Scan the QR code to the right or click the link below for a step-by-step tutorial on selecting a simple random sample using StatCrunch. https://youtu.be/7jGJ2tG-doo ● ● ● ● Find the mean and standard deviation of magnitude of the earthquakes in your sample Min = ● X = 2.726 Find the five number summary of the magnitudes of the earthquakes in your sample Q₁ = Q3 2.82 2.5 Compute the following: S=0,28367782 0,26 IQR= 2.56 Q₂ = 2.665 we can use the interquattile range (IQR) method for identifying outliers. -0,3224 = Max = IQR 1.5 x IQR = IQR+ 1.5 x IQR = 0.4576 During the 1989 world series, a 6.9 magnitude earthquake struck the bay area.¹ In the context of the magnitudes considered here, is this magnitude an outlier? Explain why or why not. To determine if the magnitude of 6.9 from the 1989 world series earthquake is an outlier or not, Lower fence = Q1 - 1.5 x IQR Upper fence = Q3 +1.5 x IQR Substituting the given values, we get: Lower fence = 2.56 1.5 x 0.26 = 2.17 3.97 The IQR is 0.26, as given in the problem Upper fence = 2.82 + 1.5 x 0.26 = 3.21 statement. To find the fences for outlier detection, we can use the following formulas: Since the magnitude of the earthquake (6.9) is well beyond the upper fence (3.21), it is indeed an outlier. California's Great ShakeOut drill is based on a scenario involving a magnitude 7.8 earthquake.² In the context of the magnitudes considered here, is this magnitude an outlier? Explain why or why not. Upload your sample to this Canvas assignment as either a .SCS file, CSV file, or Excel format file.

Glencoe Algebra 1, Student Edition, 9780079039897, 0079039898, 2018
18th Edition
ISBN:9780079039897
Author:Carter
Publisher:Carter
Chapter10: Statistics
Section10.4: Distributions Of Data
Problem 3GP

Related questions
Question
Please help with the question about the CA great shake out drill
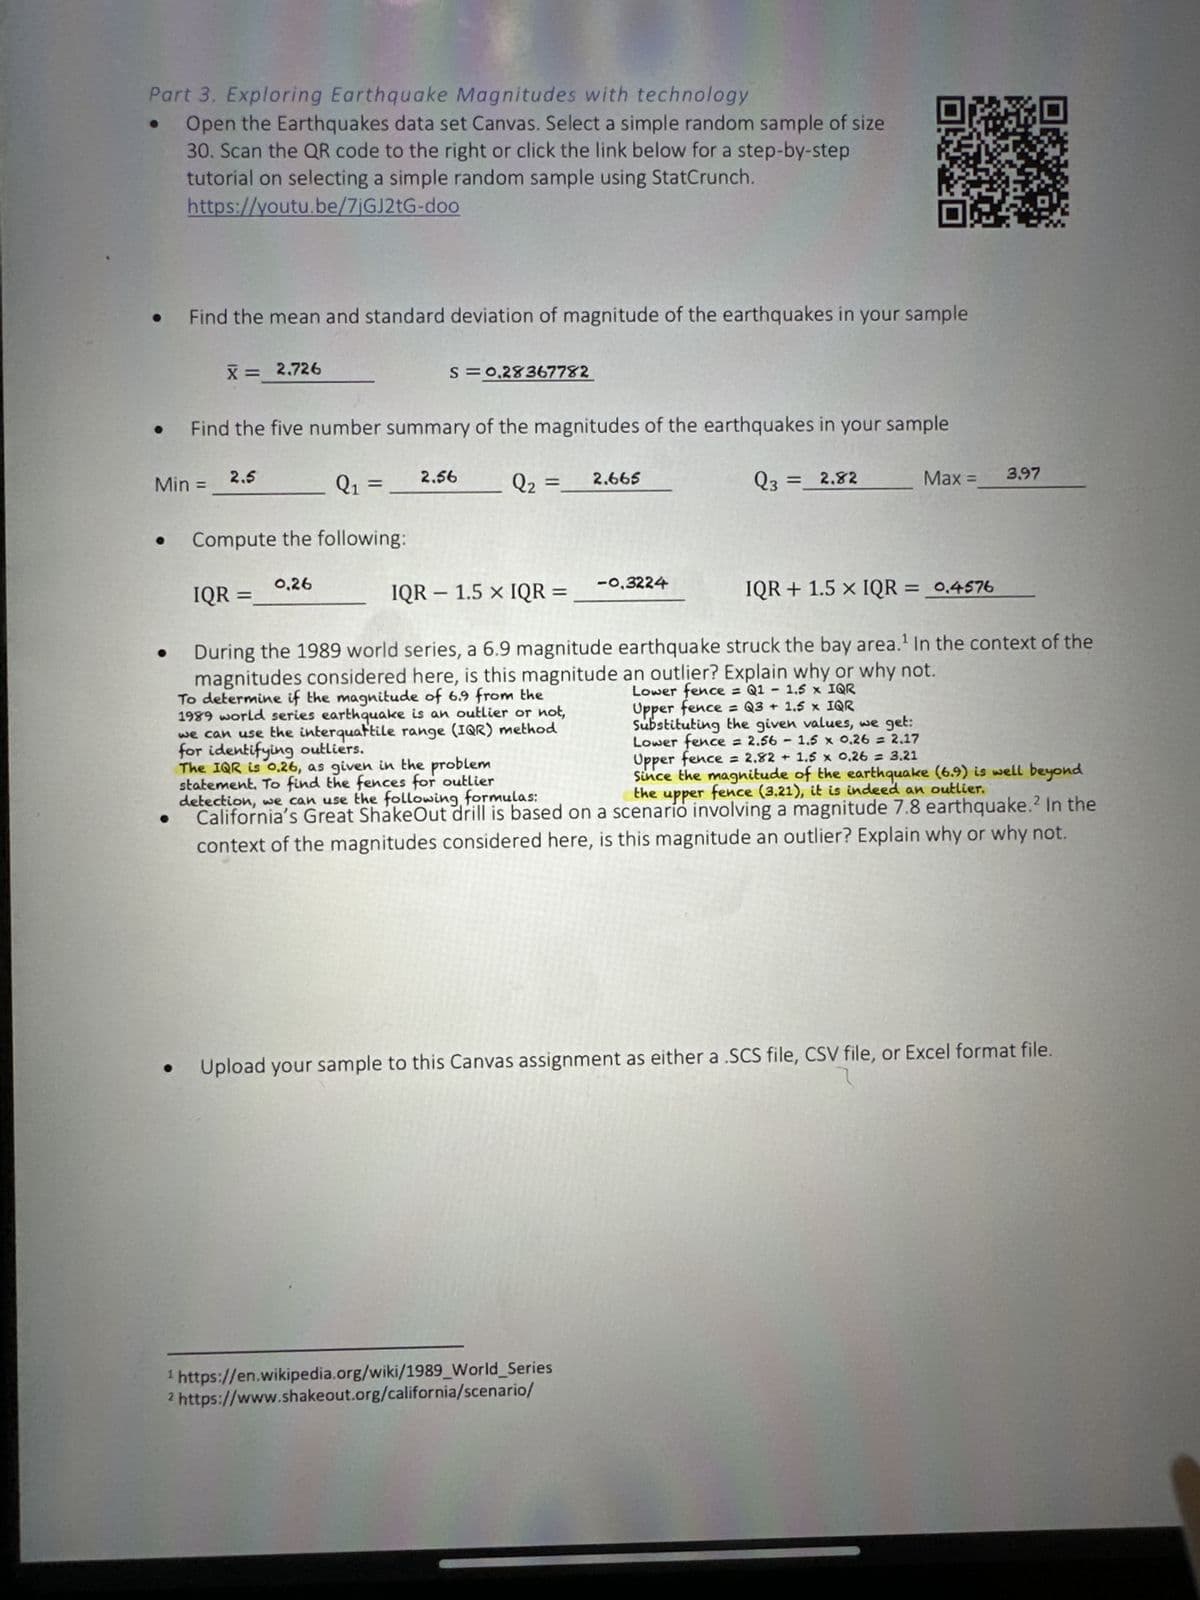
Transcribed Image Text:Part 3. Exploring Earthquake Magnitudes with technology
Open the Earthquakes data set Canvas. Select a simple random sample of size
30. Scan the QR code to the right or click the link below for a step-by-step
tutorial on selecting a simple random sample using StatCrunch.
https://youtu.be/7jGJ2tG-doo
•
Find the mean and standard deviation of magnitude of the earthquakes in your sample
X = 2.726
Min =
Find the five number summary of the magnitudes of the earthquakes in your sample
Q₁ =
Q3 = 2.82
2.5
Compute the following:
IQR =
S = 0,28367782
0.26
2.56
Q₂ =
IQR - 1.5 x IQR =
2.665
-0.3224
¹ https://en.wikipedia.org/wiki/1989_World_Series
2 https://www.shakeout.org/california/scenario/
Max =
IQR + 1.5 x IQR = 0.4576
3.97
During the 1989 world series, a 6.9 magnitude earthquake struck the bay area.¹ In the context of the
magnitudes considered here, is this magnitude an outlier? Explain why or why not.
Lower fence = Q1 - 1.5 x IQR
To determine if the magnitude of 6.9 from the
1989 world series earthquake is an outlier or not,
we can use the interquattile range (IQR) method
for identifying outliers.
Upper fence = Q3 + 1.5 x IQR
Substituting the given values, we get:
Lower fence = 2.56 1.5 x 0.26 = 2.17
The IQR is 0,26, as given in the problem
Upper fence = 2.82 + 1.5 x 0.26 = 3.21
Since the magnitude of the earthquake (6.9) is well beyond
statement. To find the fences for outlier
the upper fence (3.21), it is indeed an outlier.
detection, we can use the following formulas:
California's Great ShakeOut drill is based on a scenario involving a magnitude 7.8 earthquake.² In the
context of the magnitudes considered here, is this magnitude an outlier? Explain why or why not.
• Upload your sample to this Canvas assignment as either a .SCS file, CSV file, or Excel format file.
Expert Solution
This question has been solved!
Explore an expertly crafted, step-by-step solution for a thorough understanding of key concepts.

This is a popular solution!

Trending now
This is a popular solution!

Step by step
Solved in 2 steps

Recommended textbooks for you
Glencoe Algebra 1, Student Edition, 9780079039897…
Algebra
ISBN:
9780079039897
Author:
Carter
Publisher:
McGraw Hill
Glencoe Algebra 1, Student Edition, 9780079039897…
Algebra
ISBN:
9780079039897
Author:
Carter
Publisher:
McGraw Hill