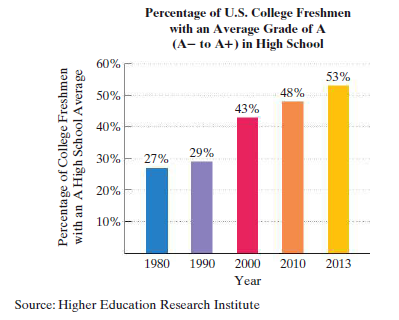
Percentage of U.S. College Freshmen with an Average Grade of A (A- to A+) in High School 60% 53% 50% 48% 43% 40% 29% 30% 27% 20% 10% 1980 1990 2000 2010 2013 Year Source: Higher Education Research Institute Percenta ge of College Freshmen with an A High School Avera ge


Contingency Table
A contingency table can be defined as the visual representation of the relationship between two or more categorical variables that can be evaluated and registered. It is a categorical version of the scatterplot, which is used to investigate the linear relationship between two variables. A contingency table is indeed a type of frequency distribution table that displays two variables at the same time.
Binomial Distribution
Binomial is an algebraic expression of the sum or the difference of two terms. Before knowing about binomial distribution, we must know about the binomial theorem.
Grade Inflation. The bar graph shows the percentage of U.S. college freshmen with an average grade of A in high school.The data displayed by the bar graph can be described by the mathematical model : p = (4x / 5) + 25, where x is the number of years after 1980 and p is the percentage of U.S. college freshmen who had an average grade of A in high school. Use this information to solve:
b. If trends shown by the formula (mathematical model) continue, project when 65% of U.S. college freshmen will have had an average grade of A in high school.


Trending now
This is a popular solution!

Step by step
Solved in 2 steps with 9 images


