PING IS Turnura. P = (b) Make a graph of the linear formula you found in part (a). This is called the market supply curve. P 3 0 NOTES for MOD....pdf P O 0.5 0.5 1 1 1.5 2 2.5 S 1.5 S 2 2.5 O 0.5 0.5 1 1.5 S 1.5 S 2 2 2.5 2.5 3 (c) Explain why the market supply curve should be increasing. (Hint: Think about what should happen when the price increases.) If the price increases, then the wheat suppliers will want to produce more wheat. This means that the market supply curve will be going up to the -Select-, s (d) How much wheat (in billions of bushels) would suppliers be willing to produce in a year and offer for sale at a price of $3.83 per bushel? (Round your answer to two de billion bushels
PING IS Turnura. P = (b) Make a graph of the linear formula you found in part (a). This is called the market supply curve. P 3 0 NOTES for MOD....pdf P O 0.5 0.5 1 1 1.5 2 2.5 S 1.5 S 2 2.5 O 0.5 0.5 1 1.5 S 1.5 S 2 2 2.5 2.5 3 (c) Explain why the market supply curve should be increasing. (Hint: Think about what should happen when the price increases.) If the price increases, then the wheat suppliers will want to produce more wheat. This means that the market supply curve will be going up to the -Select-, s (d) How much wheat (in billions of bushels) would suppliers be willing to produce in a year and offer for sale at a price of $3.83 per bushel? (Round your answer to two de billion bushels

Functions and Change: A Modeling Approach to College Algebra (MindTap Course List)
6th Edition
ISBN:9781337111348
Author:Bruce Crauder, Benny Evans, Alan Noell
Publisher:Bruce Crauder, Benny Evans, Alan Noell
Chapter3: Straight Lines And Linear Functions
Section3.3: Modeling Data With Linear Functions
Problem 13E: Market supply The following table shows the quantity S of wheat, in billions of bushels, that wheat...

Related questions
Question
question is too big for one picture
Transcribed Image Text:PING ILS TOTfidia.
P =
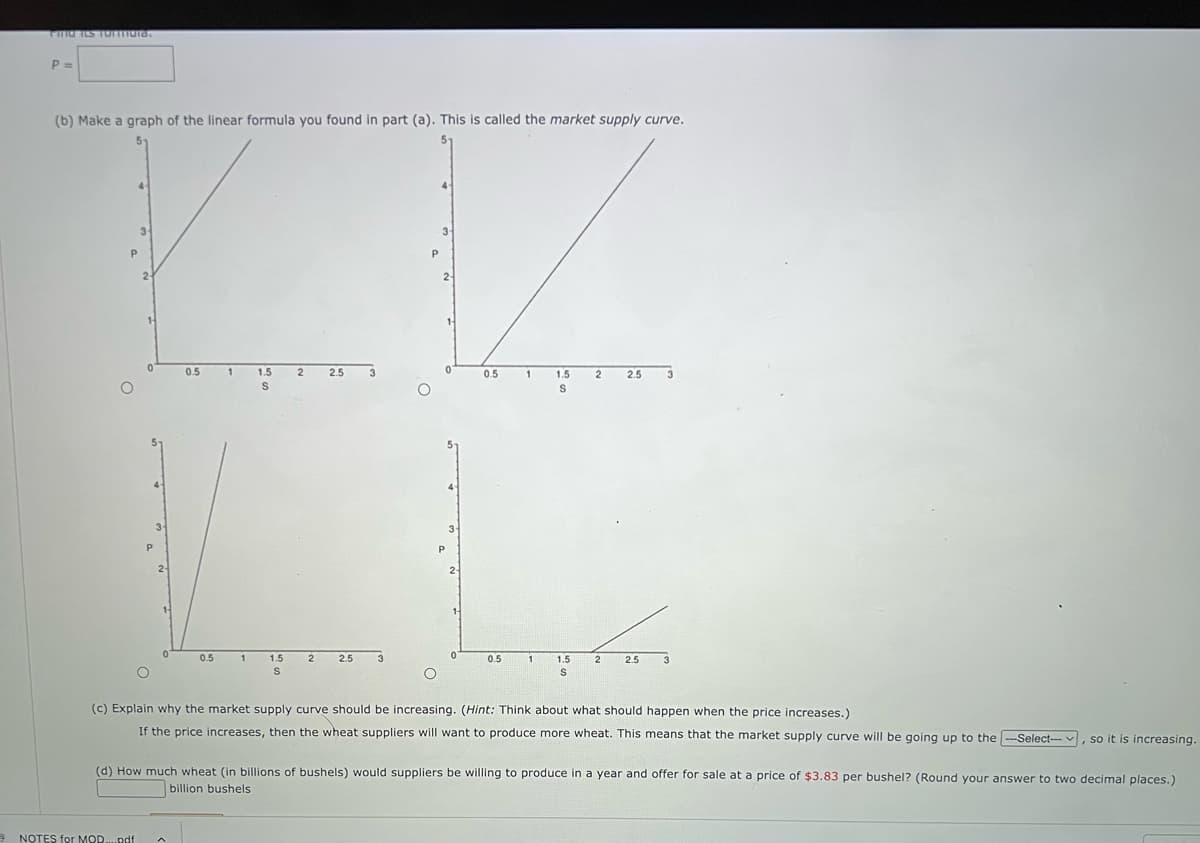
(b) Make a graph of the linear formula you found in part (a). This is called the market supply curve.
P
0.5
0.5
NOTES for MOD....pdf
1 1.5
S
1
1.5
S
2
2.5
2 2.5 3
0.5
0.5
1 1.5
S
1
S
2 2.5
2
2.5
3
(c) Explain why the market supply curve should be increasing. (Hint: Think about what should happen when the price increases.)
If the price increases, then the wheat suppliers will want to produce more wheat. This means that the market supply curve will be going up to the ---Select-, so it is increasing.
(d) How much wheat (in billions of bushels) would suppliers be willing to produce in a year and offer for sale at a price of $3.83 per bushel? (Round your answer to two decimal places.)
billion bushels
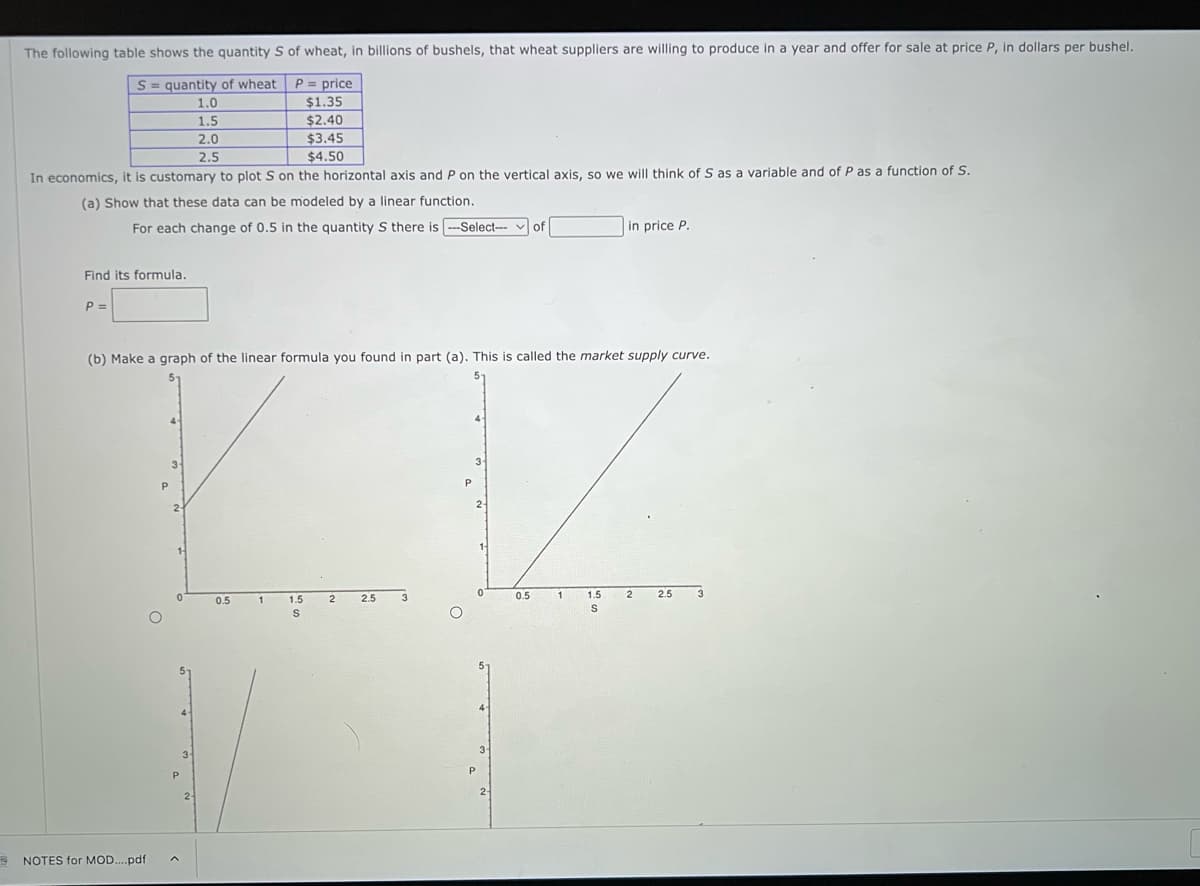
Transcribed Image Text:The following table shows the quantity S of wheat, in billions of bushels, that wheat suppliers are willing to produce in a year and offer for sale at price P, in dollars per bushel.
Squantity of wheat
P = price
$1.35
$2.40
$3.45
$4.50
In economics, it is customary to plot S on the horizontal axis and P on the vertical axis, so we will think of S as a variable and of P as a function of S.
(a) Show that these data can be modeled by a linear function.
Find its formula.
P =
1.0
1.5
2.0
2.5
For each change of 0.5 in the quantity S there is --Select-of
B NOTES for MOD....pdf
(b) Make a graph of the linear formula you found in part (a). This is called the market supply curve.
XIZ
0.5
1
1.5
S
2
2.5
0
0.5
1
in price P.
1.5
S
2.5
Expert Solution
This question has been solved!
Explore an expertly crafted, step-by-step solution for a thorough understanding of key concepts.

Step by step
Solved in 4 steps with 2 images

Recommended textbooks for you
Functions and Change: A Modeling Approach to Coll…
Algebra
ISBN:
9781337111348
Author:
Bruce Crauder, Benny Evans, Alan Noell
Publisher:
Cengage Learning

Algebra & Trigonometry with Analytic Geometry
Algebra
ISBN:
9781133382119
Author:
Swokowski
Publisher:
Cengage

Algebra: Structure And Method, Book 1
Algebra
ISBN:
9780395977224
Author:
Richard G. Brown, Mary P. Dolciani, Robert H. Sorgenfrey, William L. Cole
Publisher:
McDougal Littell
Functions and Change: A Modeling Approach to Coll…
Algebra
ISBN:
9781337111348
Author:
Bruce Crauder, Benny Evans, Alan Noell
Publisher:
Cengage Learning
Algebra & Trigonometry with Analytic Geometry
Algebra
ISBN:
9781133382119
Author:
Swokowski
Publisher:
Cengage
Algebra: Structure And Method, Book 1
Algebra
ISBN:
9780395977224
Author:
Richard G. Brown, Mary P. Dolciani, Robert H. Sorgenfrey, William L. Cole
Publisher:
McDougal Littell


Linear Algebra: A Modern Introduction
Algebra
ISBN:
9781285463247
Author:
David Poole
Publisher:
Cengage Learning

Algebra and Trigonometry (MindTap Course List)
Algebra
ISBN:
9781305071742
Author:
James Stewart, Lothar Redlin, Saleem Watson
Publisher:
Cengage Learning