Please process the measured horizontal range data in Excel to determine the mean, the standard deviation and the standard error of the range. Horizontal Range (m): Mean Standard Deviation Standard Error
Please process the measured horizontal range data in Excel to determine the mean, the standard deviation and the standard error of the range. Horizontal Range (m): Mean Standard Deviation Standard Error

Related questions
Question
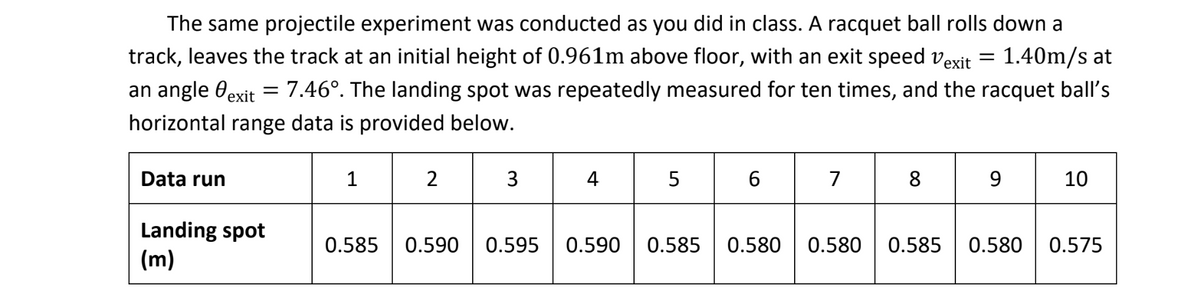
Transcribed Image Text:The same projectile experiment was conducted as you did in class. A racquet ball rolls down a
track, leaves the track at an initial height of 0.961m above floor, with an exit speed Vexit 1.40m/s at
an angle exit
7.46°. The landing spot was repeatedly measured for ten times, and the racquet ball's
horizontal range data is provided below.
Data run
=
Landing spot
(m)
1
2
0.585 0.590
3
4
0.595 0.590
5
6
0.585 0.580
7
0.580
8
=
9
10
0.585 0.580 0.575
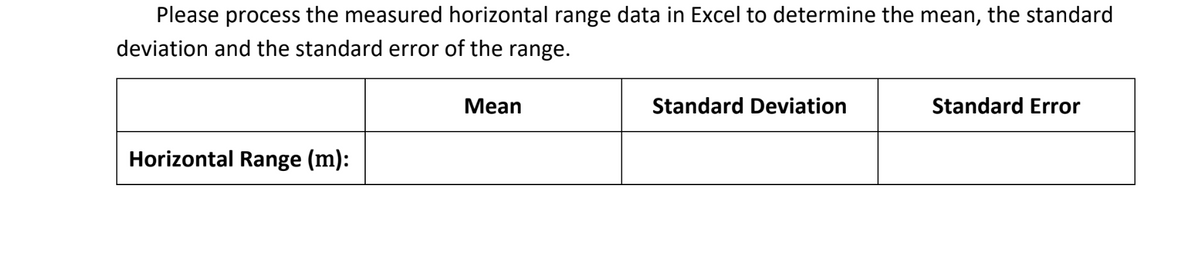
Transcribed Image Text:Please process the measured horizontal range data in Excel to determine the mean, the standard
deviation and the standard error of the range.
Horizontal Range (m):
Mean
Standard Deviation
Standard Error
Expert Solution
This question has been solved!
Explore an expertly crafted, step-by-step solution for a thorough understanding of key concepts.

Step by step
Solved in 3 steps
