Plot a line segment by clicking in two locations. Click a segment to delete it. 14 12 8 10 9 8 7 6 s -4 3 2 -1 1 2 3 4 S6 9 10 -14 16 -18 -20 You must answer all questions above in order to submit. attempt 1 out of 2 Privacy Policy Terms of Service Copyright © 2021 DeltaMath.com. All Rights Reserved.
Plot a line segment by clicking in two locations. Click a segment to delete it. 14 12 8 10 9 8 7 6 s -4 3 2 -1 1 2 3 4 S6 9 10 -14 16 -18 -20 You must answer all questions above in order to submit. attempt 1 out of 2 Privacy Policy Terms of Service Copyright © 2021 DeltaMath.com. All Rights Reserved.

Algebra & Trigonometry with Analytic Geometry
13th Edition
ISBN:9781133382119
Author:Swokowski
Publisher:Swokowski
Chapter3: Functions And Graphs
Section3.5: Graphs Of Functions
Problem 14E

Related questions
Question
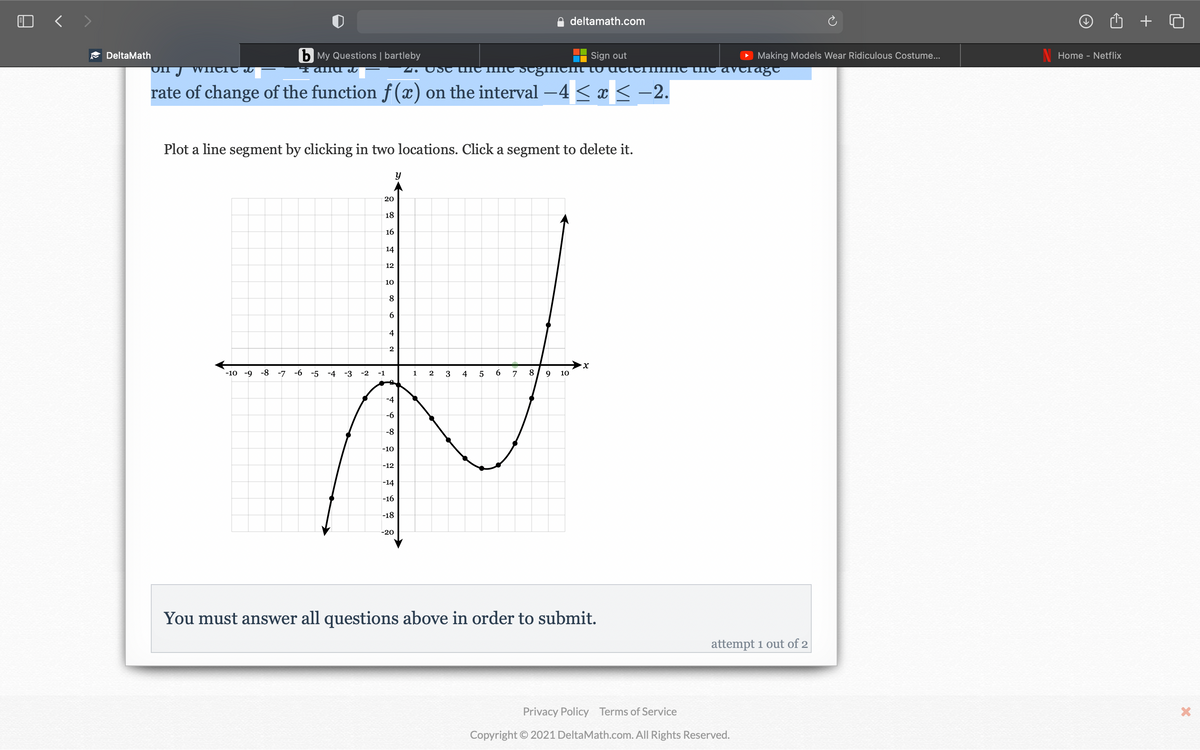
The function y=f(x)y=f(x) is graphed below. Plot a line segment connecting the points on ff where x=−4x=−4 and x=−2.x=−2. Use the line segment to determine the average rate of change of the function f(x)f(x) on the interval −4≤x≤−2.−4≤x≤−2.
Transcribed Image Text:O < >
deltamath.com
DeltaMath
b My Questions | bartleby
Sign out
D Making Models Wear Ridiculous Costume...
Home - Netflix
WnCre el
T alna u
USc tule IINC SeginIcn to dtiei me the avelağt
rate of change of the function f (x) on the interval –4 < x < -2.
Plot a line segment by clicking in two locations. Click a segment to delete it.
20
18
16
14
12
10
8
6.
4
-10 -9
-8 -7
-6
-5
-4 -3
-2
-1
1
3
4
6.
7
8
9
10
-4
-6
-8
-10
-12
-14
-16
-18
-20
You must answer all questions above in order to submit.
attempt 1 out of 2
Privacy Policy Terms of Service
Copyright © 2021 DeltaMath.com. All Rights Reserved.
Expert Solution
This question has been solved!
Explore an expertly crafted, step-by-step solution for a thorough understanding of key concepts.

This is a popular solution!

Trending now
This is a popular solution!

Step by step
Solved in 2 steps with 2 images

Recommended textbooks for you
Algebra & Trigonometry with Analytic Geometry
Algebra
ISBN:
9781133382119
Author:
Swokowski
Publisher:
Cengage

Algebra & Trigonometry with Analytic Geometry
Algebra
ISBN:
9781133382119
Author:
Swokowski
Publisher:
Cengage