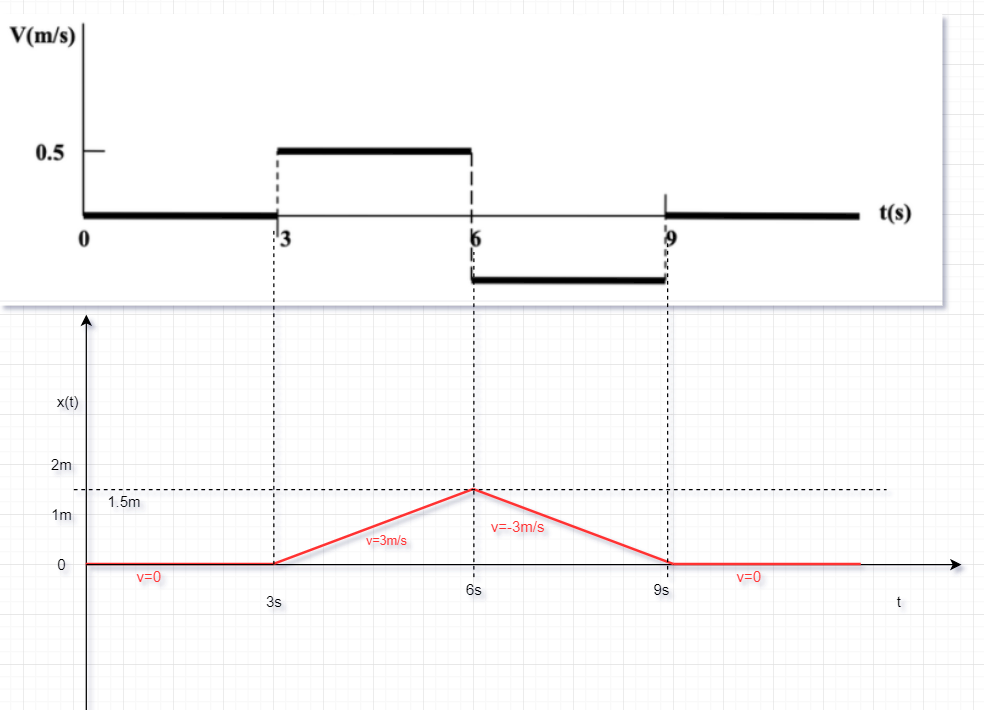
Predicting Position graphs from velocity graphs 19. a) For the following velocity graph, sketch (label each axis) what you think the position graph would have to look like. Then describe in words how you should move to produce this graph. V(m/s) 0.5 t(s) '3

Q: The radiations emitted by hot bodies are called as ________________ a) X-rays b) Black-body radiatio...
A: B
Q: Two sheets of charge, the first has a charge density of 10 nC/m2 and the second has a charge density...
A: first sheet is at y=0 and other sheet is at y=5 charge density on sheet σ1=10nC/m2 and σ2=-10nC/m2 ...
Q: Standing waves are produced in 10m long stretched string. If the string vibrates in 5 segments and w...
A: A
Q: 2-
A: Given, angle for first minimum θ=54.00wavelength λ=415 nm
Q: Which of the following is also known as pressure waves? a) Transverse waves b) Longitudinal waves c)...
A: B
Q: Which of the following cannot be conserved during Raman scattering? a) Total Energy b) Momentum c) K...
A: Collision Collision is a phenomenon where two or more objects exchange momentum and energies while b...
Q: Which of the following statements is true? a) Both light and sound waves can travel in the vacuum b)...
A: C
Q: 2) Find the resultant displacement of the following 3 displacements: A = 18.0 m, @ 24.0° E of S ...
A: The three displacements can be drawn as below,
Q: Which of the following is the characteristic of a black body? a) A perfect absorber but an imperfect...
A: C
Q: How is information extracted from a wave function? a) Expectation value b) Operators c) Differential...
A: A
Q: Sound travels through a gas under which of the following condition? a) Isothermal condition b) Non-i...
A: C
Q: Two sheets of charge, the first has a charge density of 10 nC/m2 and the second has a charge density...
A: Given σ1=10nC/m2 σ2=-10nC/m2 point (0,2,0) is located between plates. electric field due to first sh...
Q: What is the effect of intensity on the stopping potential? a) As intensity increases, stopping poten...
A: D
Q: You are given a number of 37 0 resistors, each capable of dissipating only 4.0 W without being destr...
A: Given, Number of resisters of 37 ohm and dissipated power is 4.0 W each
Q: Which one of the following is not an example of resonance? a. 2 tuning forks together produc...
A: Resonance is the phenomenon of increased amplitude of a vibrating system when a driving force with f...
Q: Which of the following is also known as pressure waves? a) Transverse waves b) Longitudinal waves c)...
A: D
Q: What is the maximum number of electrons in a shell? a) n b) 2n c) n2 d) 2n2
A: There are fixed number on electrons in each shell. Each shell is divided into sub shells named as s ...
Q: Quantum Numbers are solutions of _____________ a) Heisenberg’s Uncertainty Principle b) Einstein’s m...
A: C
Q: If the direction of velocity is changed by 180o simultaneously, the mass would _____________ a) Chan...
A: To answer: if the direction of velocity is changed simultaneously, the mass would, (a) change simult...
Q: A wheel of radius R = 10.0cm, mass M = 25.0 kg, and moment of inertia I = 0.5kg.m² is mounted on a f...
A: Applying Newton's second law of motion in rotational motion is τ=Iα............1τ-Torque about the a...
Q: A copper bar, with a temperature of 72 ° F. At 11:05 a.m., the temperature of the bar is recorded at...
A: According to Newton's law of cooling, we can write temperature as a function of time as Tt=Ce-kt+Ta....
Q: What relation between emissivity, e, and Absorptive Power, a, is given by Kirchhoff’s law? a) e <...
A: According to Kirchhoff's law states that at any given temperature the body of emissivity is exactly ...
Q: how is a cluster production by Laser ablation in physics ??
A: To answer: How is cluster production by Laser ablation?
Q: A chunk of ice (T = -20°C) is added to a thermally insulated container of cold water (T = 0°C). What...
A: Given data, Temperature of the ice = -20 0C temperature of the water = 0 0C
Q: Wave has simple harmonic motion whose period is 4seconds while another wave which also possesses sim...
A: Given: The time period of one wave is 4s. The time period of another wave is 3s. To det...
Q: As the wavelength of the radiation decreases, the intensity of the black body radiations ___________...
A: C
Q: Two wires, stretched under the same tension, have linear mass densities that differ by a factor of 4...
A:
Q: Electric Flux. A uniform electric field E = N/C passing through a flat square area A = 0.28. Calcul...
A: ϕ=EAcosθ Let electric field be 1 N/C and area be in SI units.
Q: Please perform all steps and question is correct
A: The steps are shown below. The final answer can be reached if some other conditions are provided!
Q: The celestial source of X-ray is _______________ a) Stars b) Quasars c) Black Holes d) Nebula
A: C
Q: Electromagnetic wave theory of light could not explain Black Body radiations. a) True b) False
A: a
Q: A particle moving in range (-a <x< a) and having a wavefunction Y(x) = TX sin c- If you that (x2) = ...
A: c. We can find out the standard deviation ∆x^ and ∆p^x by using the definition of standard deviation...
Q: Calculate the minimum uncertainty in the momentum of a 4He atom confined to 0.40 nm. a) 2.02 X 10⁻²⁵...
A: C
Q: When sound travels from air to water, which parameter does not change? a) Wavelength b) Frequency c)...
A: Frequency
Q: Compton shift depends on which of the following? a) Incident radiation b) Nature of scattering subst...
A: C
Q: Calculate the binding energy per nucleon of a boron nucleus ( 10B) in J/nucleon. (Given mass of neut...
A:
Q: Based on the Potential curves shown in the graph above, what are the values of the two source charge...
A: Electric Potential The electric potential at a point is defined as the amount of work done by an ext...
Q: For which quantum number, the probability of finding an electron is most? a) 1 b) 2 c) 3 d) 4
A: A
Q: The apparent frequency in Doppler’s effect does not depend upon ___________ a) Speed of the observer...
A: B
Q: Explain electromagnetic spectrum with graph and range
A: The electromagnetic spectrum is the systematic distribution of the electromagnetic radiation accordi...
Q: The momentum of a photon having energy 1.00 X 10⁻¹⁷ J is ____________ a) 2.33 X 10⁻²⁶ kg m/s b) 3.33...
A: B
Q: particle has a finite, non-zero, potential for the region ____________ a) x > 0 b) x < 0 c) 0 ...
A: C
Q: Explain in detail the wave particle dual nature of light . Give examples. Use quantum mechanics to ...
A: Light as we all know is an electromagnetic wave. But we also know that light is composed of photons....
Q: When the movable mirror of a Michaelson Interferometer is shifted through 0.0589 mm, 200 fringes cro...
A: A
Q: A fly lands on one wall of a room. The lower-left corner of the wall is selected as the origin of a ...
A: co-ordinate of origin = (0,0) co-ordinate of fly = (1.95,1.20) we know distance between to point r= ...
Q: Example 3.1 An aircraft, C, is flying in a vertical plane containing two tracking stations, A and B,...
A: Given problem can be analyzed by following figure
Q: What is the most fundamental property of wave? a) Temperature b) Pressure c) Frequency d) Wavelength
A: C
Q: What is the measurement of the velocity of moving particles the Doppler effect is based on? Remember...
A: Answer: Doppler effect: It is the phenomenon that is observed whenever the source of the waves(lig...
Q: 2. The slotted arm rotates about its center in a horizontal plane at a constant rate of Ở = 10 rad/s...
A: Given:- Mass of the slider m= wg Where, w = weight of the slider g = acceleration due...
Q: Electric Field. Two positive charges are located on the x-axis. The second charge (has twice the mag...
A:

The position time graph for the motion describes by the given v-t graph is plotted below,

Step by step
Solved in 2 steps with 1 images
