Problem #2 The lines on this graph represent the different driving speeds of a car. Use the graph to answer the following questions. Driving Speeds of a Car 10 A B 6. 8 6 D 50 100 150 200 250 300 Position (km) (a) Convert 3.0 × 10⁵ m to min' km Show your werk. 3,0x10 ür TO Min (b) Calculate the speeds for each of the lines and list the lines from FASTEST to SLOWEST. 41 (s) au
Problem #2 The lines on this graph represent the different driving speeds of a car. Use the graph to answer the following questions. Driving Speeds of a Car 10 A B 6. 8 6 D 50 100 150 200 250 300 Position (km) (a) Convert 3.0 × 10⁵ m to min' km Show your werk. 3,0x10 ür TO Min (b) Calculate the speeds for each of the lines and list the lines from FASTEST to SLOWEST. 41 (s) au

Related questions
Question
Can I please get help with the third question please (b) thank you very much.
Transcribed Image Text:(e) Describe and determine the velocity between the pair of data points where the
Toy Car's Eastward velocity is the greatest?
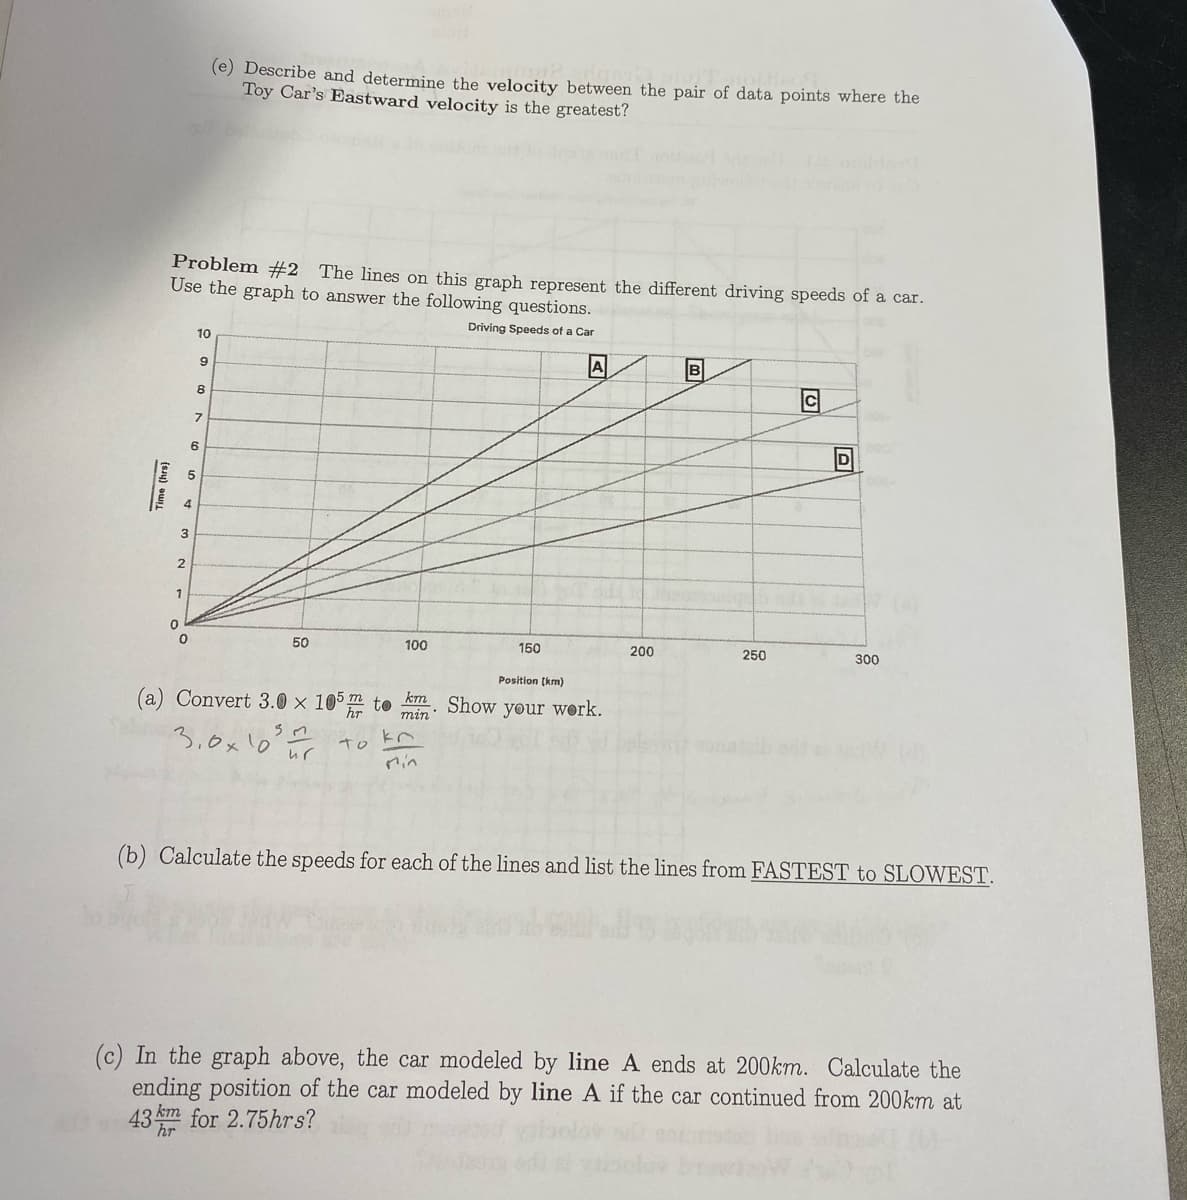
Problem #2 The lines on this graph represent the different driving speeds of a car.
Use the graph to answer the following questions.
Driving Speeds of a Car
10
B
9
8
7
6
1
50
100
150
200
250
300
Position (km)
(a) Convert 3.0 × 10⁵m to
km
Show your work.
min
3,0x10 ur
To
Min
(b) Calculate the speeds for each of the lines and list the lines from FASTEST to SLOWEST.
(c) In the graph above, the car modeled by line A ends at 200km. Calculate the
ending position of the car modeled by line A if the car continued from 200km at
43 m for 2.75hrs?
Time (hrs)
Expert Solution
This question has been solved!
Explore an expertly crafted, step-by-step solution for a thorough understanding of key concepts.

Step by step
Solved in 4 steps
