Problem 5.27 Suppose the only source of BOD in a river is untreated wastes that are being discharged from a food processing plant. The resulting oxygen sag curve has a minimum value of DO somewhere downstream equal to 3.0 mg/L See figure P 5.27. Just below the discharge point, the DO of the stream is equal to the saturation value of 10.0 mg/L. By what percent should the DO of the wastes be reduced to assure a healthy stream with at least 5.0 mg/L of DO everywhere? Would a primary treatment plant be sufficient to achieve this reduction? Assume that a primary treatment plant removes 35% of BOD. If the stream flows 60 miles per day, has a reaeration coefficient kr equal to 0.80/day, and has a deoxygenation coefficient kd of 0.20/day, how far downstream (miles) would the lowest DO occur? What ultimate BOD (L0 mg/L) of the mixture of river and waste just downstream from the discharge point would cause the minimum DO to be 5.0 mg/L? d.Sketch the oxygen sag curve before and after treatment recommended in (a) labeling critical points (DOmin location and value).
Problem 5.27 Suppose the only source of BOD in a river is untreated wastes that are being discharged from a food processing plant. The resulting oxygen sag curve has a minimum value of DO somewhere downstream equal to 3.0 mg/L See figure P 5.27. Just below the discharge point, the DO of the stream is equal to the saturation value of 10.0 mg/L. By what percent should the DO of the wastes be reduced to assure a healthy stream with at least 5.0 mg/L of DO everywhere? Would a primary treatment plant be sufficient to achieve this reduction? Assume that a primary treatment plant removes 35% of BOD. If the stream flows 60 miles per day, has a reaeration coefficient kr equal to 0.80/day, and has a deoxygenation coefficient kd of 0.20/day, how far downstream (miles) would the lowest DO occur? What ultimate BOD (L0 mg/L) of the mixture of river and waste just downstream from the discharge point would cause the minimum DO to be 5.0 mg/L? d.Sketch the oxygen sag curve before and after treatment recommended in (a) labeling critical points (DOmin location and value).

Chapter2: Loads On Structures
Section: Chapter Questions
Problem 1P

Related questions

Question
Problem 5.27 Suppose the only source of BOD in a river is untreated wastes that are being discharged from a food processing plant. The resulting oxygen sag curve has a minimum value of DO somewhere downstream equal to 3.0 mg/L See figure P 5.27. Just below the discharge point, the DO of the stream is equal to the saturation value of 10.0 mg/L.
- By what percent should the DO of the wastes be reduced to assure a healthy stream with at least 5.0 mg/L of DO everywhere? Would a primary treatment plant be sufficient to achieve this reduction? Assume that a primary treatment plant removes 35% of BOD.
- If the stream flows 60 miles per day, has a reaeration coefficient kr equal to 0.80/day, and has a deoxygenation coefficient kd of 0.20/day, how far downstream (miles) would the lowest DO occur?
- What ultimate BOD (L0 mg/L) of the mixture of river and waste just downstream from the discharge point would cause the minimum DO to be 5.0 mg/L?
d.Sketch the oxygen sag curve before and after treatment recommended in (a) labeling critical points (DOmin location and value).
Transcribed Image Text:S
curve sh
of BOD). Notice that down-
stream is expressed both in miles and days required to reach a given spot.
(a) Suppose the treatment plant breaks down, and it no longer removes any BOD. Sketch
the new oxygen sag curve a long time after the breakdown. Label the coordinates of
the critical distance downriver.
(b) Sketch the oxygen sag curve as it would have been only four days after the break-
down of the treatment plant.
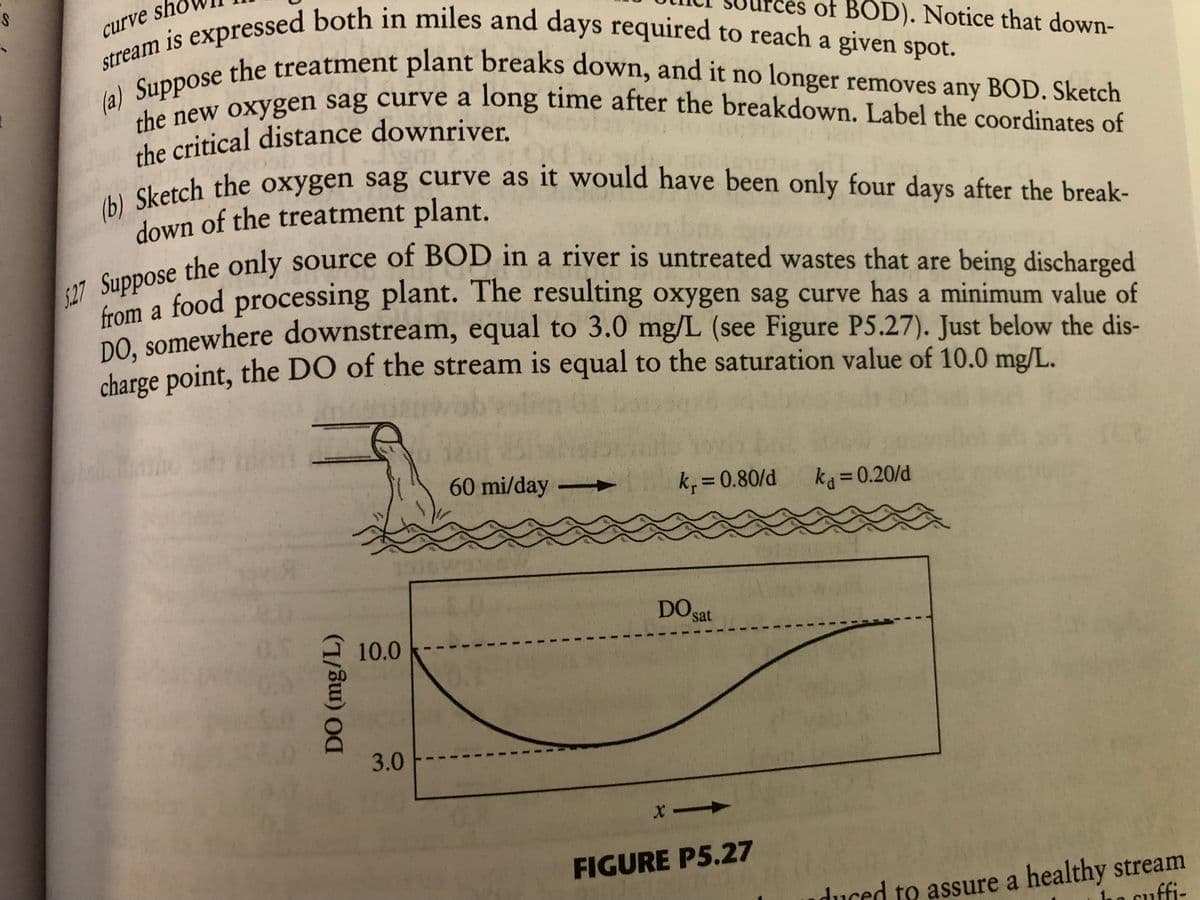
5.27 Suppose the only source of BOD in a river is untreated wastes that are being discharged
from a food processing plant. The resulting oxygen sag curve has a minimum value of
DO, somewhere downstream, equal to 3.0 mg/L (see Figure P5.27). Just below the dis-
charge point, the DO of the stream is equal to the saturation value of 10.0 mg/L.
DEL
DO (mg/L)
1534
10.0
3.0
60 mi/day
1k₁=0.80/d
DO sat
x->>
FIGURE P5.27
ka = 0.20/d
duced to assure a healthy stream
suffi-
Expert Solution
This question has been solved!
Explore an expertly crafted, step-by-step solution for a thorough understanding of key concepts.

This is a popular solution!

Trending now
This is a popular solution!

Step by step
Solved in 6 steps with 10 images

Knowledge Booster


Learn more about
Need a deep-dive on the concept behind this application? Look no further. Learn more about this topic, civil-engineering and related others by exploring similar questions and additional content below.Recommended textbooks for you

Structural Analysis (10th Edition)
Civil Engineering
ISBN:
9780134610672
Author:
Russell C. Hibbeler
Publisher:
PEARSON

Principles of Foundation Engineering (MindTap Cou…
Civil Engineering
ISBN:
9781337705028
Author:
Braja M. Das, Nagaratnam Sivakugan
Publisher:
Cengage Learning
Structural Analysis (10th Edition)
Civil Engineering
ISBN:
9780134610672
Author:
Russell C. Hibbeler
Publisher:
PEARSON
Principles of Foundation Engineering (MindTap Cou…
Civil Engineering
ISBN:
9781337705028
Author:
Braja M. Das, Nagaratnam Sivakugan
Publisher:
Cengage Learning

Fundamentals of Structural Analysis
Civil Engineering
ISBN:
9780073398006
Author:
Kenneth M. Leet Emeritus, Chia-Ming Uang, Joel Lanning
Publisher:
McGraw-Hill Education


Traffic and Highway Engineering
Civil Engineering
ISBN:
9781305156241
Author:
Garber, Nicholas J.
Publisher:
Cengage Learning