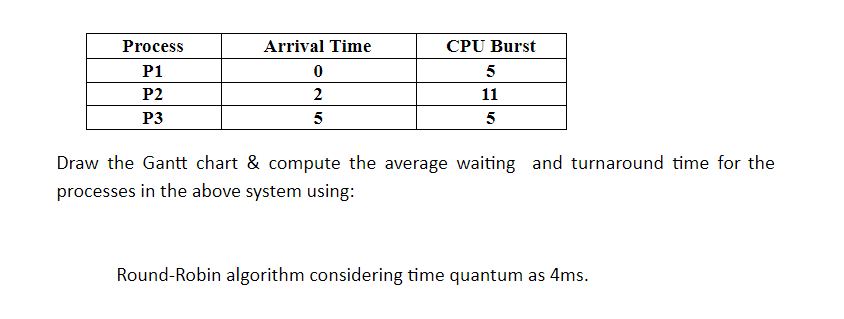
Process P1 P2 P3 Arrival Time 0 2 5 CPU Burst 5 11 5 Draw the Gantt chart & compute the average waiting and turnaround time for the processes in the above system using:


Q: Let f: R → R be given by f (x) = (x − 1)². Prove that f(x) is neither one-to-one nor onto.
A: Suppose x1 and x2 are real numbers such that f(x1) = f(x2). (We need to show x1 ≠ x2). x1 - 12 = x2…
Q: Why does JMeter become a natural solution for the tester when it comes to performance testing?
A: Why does JMeter become a natural solution for the tester when it comes to performance testing?…
Q: How quickly can you execute performance testing?
A: Introduction: The number of transactions that are carried out throughout the course of a test is…
Q: In what ways does UDP act as the system's backbone?
A: Answer: The implementation of the UDP protocol is fairly simple when compared to the development of…
Q: Scripts and stored procedures are two distinct forms of code. What do they all do? How do Stored…
A: Introduction: The term "stored process" (sometimes sometimes "routine," a ps, an SP, a proc, a…
Q: What is the relationship between cohesion and coupling when it comes to the design and development…
A: Introduction: The connection inside the module is referred to as its "cohesion."The connection of…
Q: The distinguishing characteristics of big data are speed and diversity. What do these…
A: Required: Big data has two characteristics: diversity and velocity. What does each of these…
Q: What is a value of y after the following swit int x = 3; int y = 4; switch (x + y) { case 6: y = 0;…
A: Selection statements are used to execute a particular set of statements if a certain condition is…
Q: Write a java program that computes the value of Y for the value of X ranging from 1 to 10 using the…
A: Following is the java program that computes the value of Y for the value of X ranging from 1 to 10…
Q: advantageous to use temperature monito
A: introduction : Temperature monitoring system is a monitoring system which is used to measure the…
Q: Run in java program Write a program to take a string as input and output its reverse. The given code…
A: Here is the java program of the above problem. See below step for code.
Q: What is computer graphics?
A: With the use of programming, computer graphics is the skill of creating images for display on…
Q: 4. Write a MATLAB program to plot sin(x) and cos(x) for x values ranging from 0 to 4 (in same Figure…
A: Below I have provided a program for the given question. Also, I have attached a screenshot of the…
Q: Find an optimal solution to the fractional knapsack problem
A: One of the methods used to solve the knapsack issue is the fractional knapsack problem. The items…
Q: What is the link between cohesion and coupling in the realm of software development?
A: Introduction: Cohesion: A smart software design decomposes the issue into modules and arranges them…
Q: This variable stores the number of source-level statements as well as the number of I/O operations.
A: Answer is in next step.
Q: 2. Define PAM and write down its drawbacks?
A:
Q: How do cohesion and coupling differ from one another in the context of software development?
A: In software, how the various lines of modules and code written within those modules are linked is…
Q: How distinct are Stored Procedures and Scripts? Where and why do Stored Procedures fall short?
A: DIFFERENCE BETWEEN STORED PROCEDURES AND SCRIPTS - The SQL Stored Procedure is a collection of…
Q: What exactly does the term "personal computer" mean?
A: In the mid-19th century, computers are basically experimental machines which are used for very…
Q: A number 428 in duodenary (base 12) is to be added to C10 in tredinary (base 13). The sum will be…
A: Introduction As the numbers and result are in different bases, we first have to convert the numbers…
Q: What does the acronym CIA stand for in terms of computer network security?
A: Introduction: The acronym "CIA" is often used in the area of information security (InfoSec),…
Q: A contact list is a place where you can store a specific contact with other associated information…
A: #include <iostream> using namespace std; struct ContactInfo{ string name; string…
Q: Write a function that takes in 2 single-argument functions, f and g, and returns another lambda…
A: code- add_two=lambda x:x+2square=lambda x:x**2 def compose(f,g): return lambda x:f(g(x))…
Q: When would it be advantageous to use temperature monitoring systems?
A: The answer of the question is given below
Q: How should data be compiled for a comprehensive operations manual? Exists a maximum number of names…
A: Introduction The Sequential Search is a technique for searching that involves checking the item…
Q: What is the relationship between cohesion and coupling when it comes to the design and development…
A: We need to discuss the relationship between cohesion and coupling when it comes to the design and…
Q: List at least six publications that can be produced using DTP.
A: DTP Desktop publishing is the creation of page designs using a specialized DTP program on your…
Q: L Functions: • Write a function that receives three arguments (a string containing a single…
A: Here is the c++ program of the above code. See below step for code.
Q: How quickly can you execute performance testing?
A: Introduction: The speed of an application is often one of its most critical characteristics.…
Q: What exactly is a load balancer? What is the purpose of a load balancing device?
A: Using a load balancer may improve your application's efficiency and durability. They boost…
Q: What exactly is a "DRE"?
A: According to the information given:- We have to define DRE.
Q: A recent IBM survey indicated that just one-third of the 585 mobile app developers and managers who…
A: When creating and deploying a mobile app under a constrained FIMC timeframe, the following possible…
Q: What are the dangers of maintaining your physical condition for racing?
A: Introduction: Race condition: Without synchronisation, many processes or threads inside a process…
Q: Consider your position inside a system. What is the purpose of the value chain? What is your…
A: Answer: We need to write the what is value chain and how they will works and how to measure the…
Q: 2. Define PAM and write down its drawbacks?
A: PAM Pulse Amplitude Modulation is a method by which the amplitude of the regularly spaced pulses…
Q: How can a local area network's dependability and accessibility be ensured
A: The acronym for this kind of network is LAN. A local area network (LAN) is a collection of…
Q: Why does JMeter become a natural solution for the tester when it comes to performance testing?
A: Introduction: The JMeter is used by testers for a variety of reasons due to its versatility. Listed…
Q: What is the link between cohesion and coupling in terms of how things function together in software…
A: Coupling tells us how strongly modules and classes are connected to each other, while cohesion tells…
Q: What does "personal computer" really mean?
A: Introduction: A personal computer, sometimes known as a PC, is a kind of digital computer that only…
Q: How closely are cohesion and coupling related to one another in software development?
A: Cohesion and coupling will be examined in terms of software development.
Q: Explain why scanning UDP is more harder than scanning TCP (TCP). List the differences between active…
A: SQLiteOpenHelper: A assistance class for managing database activity is provided by Android. The…
Q: a.jpg (IMAGE) of this FA after removing all non-determinism. 90 Choose a File 91 92 q3 94 a 95
A: Here in this question we have given a finite automata and we have asked to remove all its non…
Q: The content of the AL register after execution of instruction (MOV AL,65) is * Store 01100001 in AL…
A: Given that,
Q: Ensure that you understand the distinction between parallel and serial programming
A: In parallel programming, the instructions of the program are divided into small chunks so that they…
Q: When would it be advantageous to use temperature monitoring systems?
A: Introduction: Precision temperature monitoring of coolers, freezers, and heaters ensures patient…
Q: 5. Let S = {a,b,c,d}, T = {a,c, e, f}, R = {c, f}. Find the following sets. (a) SUT (b) SnT (c)…
A: In this question we have to solve these given questions. Let's solve
Q: Could a solution be given without using vectors? Thank you.
A: Previous code is wrong #include <iostream> using namespace std; struct ContactInfo{…
Q: How are cohesion and coupling related to one another in the area of software design and development?
A: Cohesion: The utility of a module's interconnectedness is gauged by its cohesion. The fraction of…
Q: How do cohesion and coupling interact in the development of computer programmes?
A: Interaction of cohesion and coupling in development of computer programmes

Step by step
Solved in 4 steps with 2 images


- Assume there are two dependent processes, which synchronization algorithm will you choose for the best performance? Justify? Can you choose the same algorithm if there are more than two processes?Consider the following set of processes, with the length of the CPU burst given in milliseconds Draw the Gantt Chart and calculate the Waiting time and the turnaround time. Upload the solution as a fileThree processes of an operating system has P(arrival time, burst time) as follows: P1(0,6),P2(2,5), P3(4,2). Work out the average waiting time in this system when processes are scheduled with Shortest-Remaining-Time-First scheduling algorithm. a)1.3 b)3 c)4 d) 2.5 Note : please with explain Oprating system
- Given a set of processes and burst time draw the gantt chart using scheduler Round Robin Time Quantum= 4 milliseconds Process Burst Time P1 24 P2 4 P3 4OPERATING SYSTEMS, ANSWER IN 10 MINUTES, DO NOT BE LATE PLEASE !!!!!!!! Consider the following set of processes with the length of the next CPU burst given in milliseconds: P1 - 8 ms, P2 - 4 ms, P3 - 1 ms. Select the Gantt chart illustrating the execution of these processes using the pre-emptive Round Robinscheduling algorithm with quantum = 2.Consider the following processes with the given CPU arrival time and burst time. Please use the round-robin with quantum 10 to compute for the waiting times for each process.
- Given the following table, how will these processes be scheduled using RR algorithm with quantum = 5 ms and context switch time = 1 ms ? Create a Gantt chart showing when each process will be scheduled, and calculate the average waiting time, turnaround time and CPU utilization.Considering the problem such as Bounded-Buffer, discuss your thoughts on process synchronization.Consider the following processes with their Burst time given as:Calculate average Waiting time and average Turnaround time using SJF.
- NOTE: "Exekveringstid(ms)" means execution time or burst time in milliseconds Assume that a system with a CPU at one time has the following processes queued in the CPU's READY queue: Calculate the waiting time for the seven processes: 1) If FCFS is being used 2) If LRU is being used 3) If RR with time quantum of 8msa single process, with execution time of BT time units, is detected by the system that uses Round Robin algorithm with time quantum of QT time units. Every time the time quantum elapses; a contect switch is always performed with CS time units. Assume that the process come at time equal to zero(0) If BT is 25, QT is 10 and CS is 2, what is the Cpu utilization of the system? If BT is 20, QT is 6 and CS is 1 what is the CPU utilization of the system? What is the CPU utilization if BT is equal QT and QT is equal to CS? What is the system's throughput if BT is less than QT? What is the system's turnaround time (TAT) if BT is less than QT?Consider the following set of processes A, B, C, D with the following CPU burst time and I/O. Find the average waiting time with RR of quantum 10ms and context switch time=2ms. What is the average waiting time? Write the waiting time for processes A,B,C,D.