PROFITABILITY: Return on Capital employed Net Profit Margins SHORTTERM LIQUIDITY: Current ratio Cash ratio RATIOS INVESTMENT RATIOS: Earning per share Earnings yield LONGTERM LIQUIDITY RATIOS: Debt ratio Interest cover Current ratio Cash ratio RATIOS PROFITABILITY: Return on Capital employed Net Profit Margins SHORTTERM LIQUIDITY : INVESTMENT RATIOS: Earning per share Earnings yield RATIOS PROFITABILITY: Return on Capital employed Net Profit Margins SHORTTERM LIQUIDITY: Current ratio Cash ratio LONGTERM LIQUIDITY RATIOS: Debt ratio Interest cover INVESTMENT RATIOS: Earning per share Earnings yield RATIOS PBIT/Capital employed x 100 =-901,176/2,078,448 x 100 PBIT/Sales x 100--901,176/1,200,776 x 100 PROFITABILITY: Return on Capital employed Net Profit Margins SHORTTERM LIQUIDITY: Current ratio Cash ratio Currents Assets/Current liabilities-3,369,150/3,300,011 Cash/Current Liabilities-1,950,873/3,300,011 INVESTMENT RATIOS: Earning per share Earnings yield BASIS OF CALCULATION Total assets-Total Equity/Total Assets 9,219,254-496,509/9,219,254 PBIT/Capital employed x 100 =-901,176/2,078,448 x 100 PAT-Preference shares/Total assets x 100-815,200/9,219,254 x 100 Earnings per share/Market price x100-0.180/580,919 x 100 BASIS OF CALCULATION (GHS in '000) PBIT/Capital employed x 100-1,006,699/1,359,222 x 100 PBIT/Sales x 100-1,006,699/1,200,294 x 100 Currents/Current liabilities 1,455,221,643/2,092,033,671 Cash/Current Liabilities-963,960,922/2,092,033,671 LONGTERM LIQUIDITY RATIOS: Debt ratio Interest cover Total assets-Total Equity/Total Assets-5,437,022,118-1,028,565,337/5,437,122,118 PBIT/Capital employed x 100 = 1,006,699/1,359,222 x 100 PAT-Preference shares/Total assets x 100-904,329,633/5,437,022,118 x 100 Earnings per share/Market price x100-0.70/317,060 x 100 BASIS OF CALCULATION (GHS in '000) PBIT/Capital employed x 100 = 441,630,022/825594,888x100 PBIT/Sales x 100-441,630,22/648,945,652x 100 Currents Assests /Current liabilities-4,8907,884,350/4,289,611,463 Cash/Current Liabilities-1,361,983,610/4,289,612,463 Total assets-Total Equity/Total Assets-5,115,206,352-925,594,889/5,115,206,352 PBIT/Capital employed x 100 = 441,630,022/825594,888x100 PAT-Preference shares/Total assets x 100-324,208,915/5,115,206,352 x 100 Earnings per share/Market price x100-0.87/203,365x 100 BASIS OF CALCULATION (GHS in '000) PBIT/Capital employed x 100-376,691,351/801,861,431 x100 PBIT/Sales x 100-376691,351/609,056,356 x 100 LONGTERM LIQUIDITY RATIOS: Debt ratio Interest cover Currents/Current liabilities-5,151,040,791/4,606,196,449 Cash/Current Liabilities 1,195,640,731/4,606,196,449 Total assets-Total Equity/Total Assets-4,443,909,209-801,961,431/4,443,909,209 PBIT/Capital employed x 100 =376,691,351/801,861,431 x100 PAT-Preference shares/Total assets x 100-223,542,186/5,543,909,209 x 100 Earnings per share/Market price x100-0.112/235,236 x 100 YEAR 2022 -29.27% -40.95% 2021 YEAR 0.946 -29.27% 1.021 0.6 -8.84% 0.00% 74.1% 72.41% YEAR 2020 0.7 0.5 YEAR 2019 0.8 74.1% 16.6% 0.0% 53.49% 68.0 1.1 0.3 -0.1 53.49% 6.34% 0.0% 46.98% 61.85% 0.001 0.26 0.82 6.34% 4.03% 0.00%

Survey of Accounting (Accounting I)
8th Edition
ISBN:9781305961883
Author:Carl Warren
Publisher:Carl Warren
Chapter15: Capital Investment Analysis
Section: Chapter Questions
Problem 15.5.3MBA
icon
Related questions
Topic Video
Question

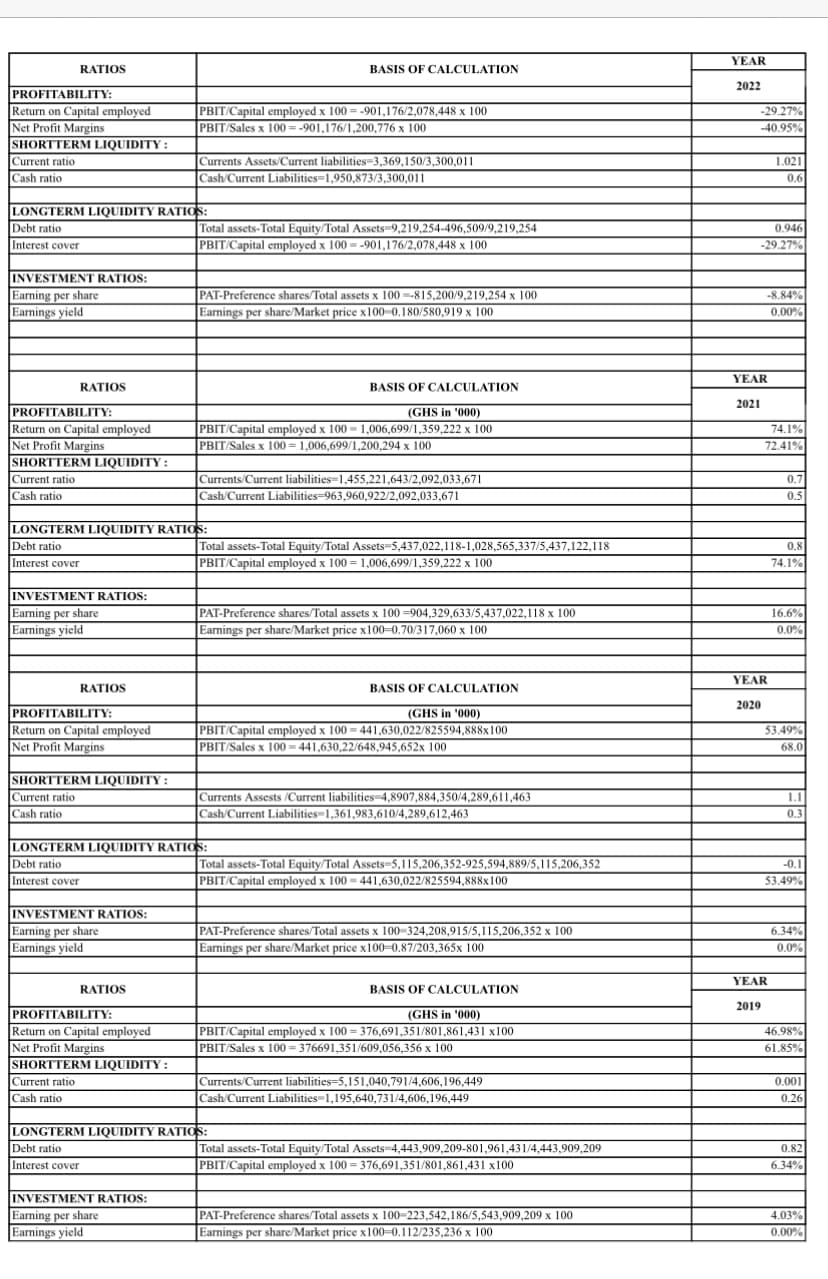
The image uploaded is the calculation of Cal Bank's Profitability ratios, shorter liquidity ratios, long-term liquidity ratios, and investment ratios for 2020, 2021, 2022. A base year of 2019 was also added. Evaluate the financial performance by comparing the three (3) years' financial performance that is 2020, 2021, and 2022 I have provided in the table with the base year. 


PROFITABILITY:
Return on Capital employed
Net Profit Margins
SHORTTERM LIQUIDITY
Current ratio
Cash ratio
RATIOS
INVESTMENT RATIOS:
Earning per share
Earnings yield
LONGTERM LIQUIDITY RATIOS:
Debt ratio
Interest cover
RATIOS
PROFITABILITY:
Return on Capital employed
Net Profit Margins
SHORTTERM LIQUIDITY:
Current ratio
Cash ratio
INVESTMENT RATIOS:
Earning per share
Earnings yield
RATIOS
PROFITABILITY:
Return on Capital employed
Net Profit Margins
SHORTTERM LIQUIDITY:
Current ratio
Cash ratio
Current ratio
Cash ratio
LONGTERM LIQUIDITY RATIOS:
Debt ratio
Interest cover
INVESTMENT RATIOS:
Earning per share
Earnings yield
RATIOS
PROFITABILITY:
Return on Capital employed
Net Profit Margins
SHORTTERM LIQUIDITY:
PBIT/Capital employed x 100 = -901,176/2,078,448 x 100
PBIT/Sales x 100 =-901,176/1,200,776 x 100
Currents Assets/Current liabilities=3,369,150/3,300,011
Cash/Current Liabilities=1,950,873/3,300,011
INVESTMENT RATIOS:
Earning per share
Earnings yield
BASIS OF CALCULATION
Total assets-Total Equity/Total Assets=9,219,254-496,509/9,219,254
|PBIT/Capital employed x 100 = -901,176/2,078,448 x 100
PAT-Preference shares/Total assets x 100 =-815,200/9,219,254 x 100
Earnings per share/Market price x100-0.180/580,919 x 100
BASIS OF CALCULATION
(GHS in '000)
PBIT/Capital employed x 100-1,006,699/1,359,222 x 100
PBIT/Sales x 100 = 1,006,699/1,200,294 x 100
Currents/Current liabilities=1,455,221,643/2,092,033,671
Cash/Current Liabilities-963,960,922/2,092,033,671
LONGTERM LIQUIDITY RATIOS:
Debt ratio
Interest cover
Total assets-Total Equity/Total Assets=5,437,022,118-1,028,565,337/5,437,122,118
PBIT/Capital employed x 100 = 1,006,699/1,359,222 x 100
PAT-Preference shares/Total assets x 100 =904,329,633/5,437,022,118 x 100
Earnings per share/Market price x100=0.70/317,060 x 100
BASIS OF CALCULATION
(GHS in '000)
PBIT/Capital employed x 100 = 441,630,022/825594,888x100
PBIT/Sales x 100=441,630,22/648,945,652x 100
Currents Assests /Current liabilities-4,8907,884,350/4,289,611,463
Cash/Current Liabilities-1,361,983,610/4,289,612,463
Total assets-Total Equity/Total Assets=5,115,206,352-925,594,889/5,115,206,352
PBIT/Capital employed x 100 = 441,630,022/825594,888x100
PAT-Preference shares/Total assets x 100-324,208,915/5,115,206,352 x 100
Earnings per share/Market price x100-0.87/203,365x 100
BASIS OF CALCULATION
(GHS in '000)
PBIT/Capital employed x 100 = 376,691,351/801,861,431 x100
PBIT/Sales x 100 = 376691,351/609,056,356 x 100
LONGTERM LIQUIDITY RATIOS:
Debt ratio
Interest cover
Currents/Current liabilities=5,151,040,791/4,606,196,449
Cash/Current Liabilities 1,195,640,731/4,606,196,449
Total assets-Total Equity/Total Assets-4,443,909,209-801,961,431/4,443,909,209
PBIT/Capital employed x 100 = 376,691,351/801,861,431 x100
PAT-Preference shares/Total assets x 100-223,542,186/5,543,909,209 x 100
Earnings per share/Market price x100=0.112/235,236 x 100
YEAR
2022
-29.27%
-40.95%
0.946
-29.27%
YEAR
2021
-8.84%
0.00%
2020
1.021
0.6
YEAR
74.1%
72.41%
0.7
0.5
YEAR
2019
0.8
74.1%
16.6%
0.0%
53.49%
68.0
1.1
0.3
-0.1
53.49%
6.34%
0.0%
46.98%
61.85%
0.001
0.26
0.82
6.34%
4.03%
0.00%
Transcribed Image Text:PROFITABILITY: Return on Capital employed Net Profit Margins SHORTTERM LIQUIDITY Current ratio Cash ratio RATIOS INVESTMENT RATIOS: Earning per share Earnings yield LONGTERM LIQUIDITY RATIOS: Debt ratio Interest cover RATIOS PROFITABILITY: Return on Capital employed Net Profit Margins SHORTTERM LIQUIDITY: Current ratio Cash ratio INVESTMENT RATIOS: Earning per share Earnings yield RATIOS PROFITABILITY: Return on Capital employed Net Profit Margins SHORTTERM LIQUIDITY: Current ratio Cash ratio Current ratio Cash ratio LONGTERM LIQUIDITY RATIOS: Debt ratio Interest cover INVESTMENT RATIOS: Earning per share Earnings yield RATIOS PROFITABILITY: Return on Capital employed Net Profit Margins SHORTTERM LIQUIDITY: PBIT/Capital employed x 100 = -901,176/2,078,448 x 100 PBIT/Sales x 100 =-901,176/1,200,776 x 100 Currents Assets/Current liabilities=3,369,150/3,300,011 Cash/Current Liabilities=1,950,873/3,300,011 INVESTMENT RATIOS: Earning per share Earnings yield BASIS OF CALCULATION Total assets-Total Equity/Total Assets=9,219,254-496,509/9,219,254 |PBIT/Capital employed x 100 = -901,176/2,078,448 x 100 PAT-Preference shares/Total assets x 100 =-815,200/9,219,254 x 100 Earnings per share/Market price x100-0.180/580,919 x 100 BASIS OF CALCULATION (GHS in '000) PBIT/Capital employed x 100-1,006,699/1,359,222 x 100 PBIT/Sales x 100 = 1,006,699/1,200,294 x 100 Currents/Current liabilities=1,455,221,643/2,092,033,671 Cash/Current Liabilities-963,960,922/2,092,033,671 LONGTERM LIQUIDITY RATIOS: Debt ratio Interest cover Total assets-Total Equity/Total Assets=5,437,022,118-1,028,565,337/5,437,122,118 PBIT/Capital employed x 100 = 1,006,699/1,359,222 x 100 PAT-Preference shares/Total assets x 100 =904,329,633/5,437,022,118 x 100 Earnings per share/Market price x100=0.70/317,060 x 100 BASIS OF CALCULATION (GHS in '000) PBIT/Capital employed x 100 = 441,630,022/825594,888x100 PBIT/Sales x 100=441,630,22/648,945,652x 100 Currents Assests /Current liabilities-4,8907,884,350/4,289,611,463 Cash/Current Liabilities-1,361,983,610/4,289,612,463 Total assets-Total Equity/Total Assets=5,115,206,352-925,594,889/5,115,206,352 PBIT/Capital employed x 100 = 441,630,022/825594,888x100 PAT-Preference shares/Total assets x 100-324,208,915/5,115,206,352 x 100 Earnings per share/Market price x100-0.87/203,365x 100 BASIS OF CALCULATION (GHS in '000) PBIT/Capital employed x 100 = 376,691,351/801,861,431 x100 PBIT/Sales x 100 = 376691,351/609,056,356 x 100 LONGTERM LIQUIDITY RATIOS: Debt ratio Interest cover Currents/Current liabilities=5,151,040,791/4,606,196,449 Cash/Current Liabilities 1,195,640,731/4,606,196,449 Total assets-Total Equity/Total Assets-4,443,909,209-801,961,431/4,443,909,209 PBIT/Capital employed x 100 = 376,691,351/801,861,431 x100 PAT-Preference shares/Total assets x 100-223,542,186/5,543,909,209 x 100 Earnings per share/Market price x100=0.112/235,236 x 100 YEAR 2022 -29.27% -40.95% 0.946 -29.27% YEAR 2021 -8.84% 0.00% 2020 1.021 0.6 YEAR 74.1% 72.41% 0.7 0.5 YEAR 2019 0.8 74.1% 16.6% 0.0% 53.49% 68.0 1.1 0.3 -0.1 53.49% 6.34% 0.0% 46.98% 61.85% 0.001 0.26 0.82 6.34% 4.03% 0.00%
Expert Solution
steps

Step by step

Solved in 5 steps

Blurred answer
Knowledge Booster
Ratio Analysis
Learn more about
Need a deep-dive on the concept behind this application? Look no further. Learn more about this topic, finance and related others by exploring similar questions and additional content below.
Similar questions
Recommended textbooks for you
Survey of Accounting (Accounting I)
Accounting
ISBN:
9781305961883
Author:
Carl Warren
Publisher:
Cengage Learning
EBK CONTEMPORARY FINANCIAL MANAGEMENT
Finance
ISBN:
9781337514835
Author:
MOYER
Publisher:
CENGAGE LEARNING - CONSIGNMENT
Intermediate Financial Management (MindTap Course…
Finance
ISBN:
9781337395083
Author:
Eugene F. Brigham, Phillip R. Daves
Publisher:
Cengage Learning
Financial Management: Theory & Practice
Finance
ISBN:
9781337909730
Author:
Brigham
Publisher:
Cengage
Principles of Accounting Volume 2
Accounting
ISBN:
9781947172609
Author:
OpenStax
Publisher:
OpenStax College
Cornerstones of Financial Accounting
Accounting
ISBN:
9781337690881
Author:
Jay Rich, Jeff Jones
Publisher:
Cengage Learning