Provide an appropriate response. A normal probability plot is given below for a sample of scores on an aptitude test. Use the plot to assess the normality of scores on this test. Explain your reasoning. Normal Score 3 2 1 0 -1 -2 -3 20 30 40 50 60 Test Score 70 80 90 100
Provide an appropriate response. A normal probability plot is given below for a sample of scores on an aptitude test. Use the plot to assess the normality of scores on this test. Explain your reasoning. Normal Score 3 2 1 0 -1 -2 -3 20 30 40 50 60 Test Score 70 80 90 100

Big Ideas Math A Bridge To Success Algebra 1: Student Edition 2015
1st Edition
ISBN:9781680331141
Author:HOUGHTON MIFFLIN HARCOURT
Publisher:HOUGHTON MIFFLIN HARCOURT
Chapter11: Data Analysis And Displays
Section11.1: Measures Of Center And Variation
Problem 34E

Related questions
Question
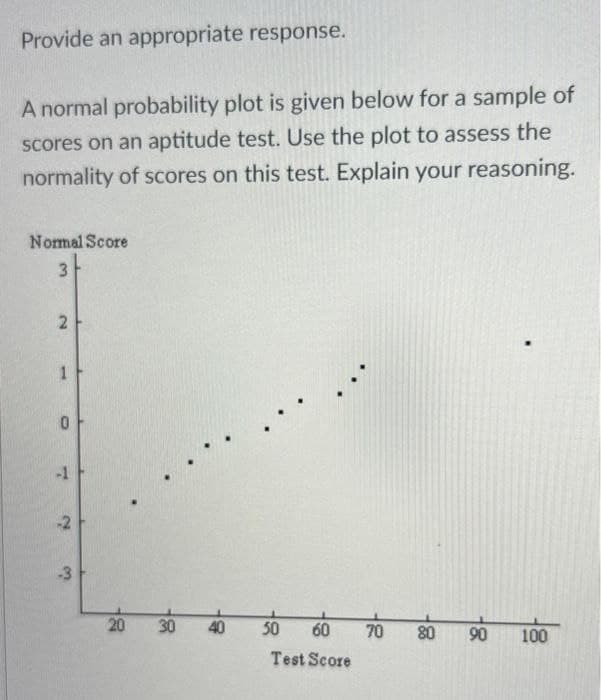
Transcribed Image Text:Provide an appropriate response.
A normal probability plot is given below for a sample of
scores on an aptitude test. Use the plot to assess the
normality of scores on this test. Explain your reasoning.
Normal Score
3
2
1
0
-1
-3
20 30
40
50 60
Test Score
70
80
90
100
Expert Solution
This question has been solved!
Explore an expertly crafted, step-by-step solution for a thorough understanding of key concepts.

Step by step
Solved in 2 steps with 2 images

Recommended textbooks for you
Big Ideas Math A Bridge To Success Algebra 1: Stu…
Algebra
ISBN:
9781680331141
Author:
HOUGHTON MIFFLIN HARCOURT
Publisher:
Houghton Mifflin Harcourt

Holt Mcdougal Larson Pre-algebra: Student Edition…
Algebra
ISBN:
9780547587776
Author:
HOLT MCDOUGAL
Publisher:
HOLT MCDOUGAL

Glencoe Algebra 1, Student Edition, 9780079039897…
Algebra
ISBN:
9780079039897
Author:
Carter
Publisher:
McGraw Hill
Big Ideas Math A Bridge To Success Algebra 1: Stu…
Algebra
ISBN:
9781680331141
Author:
HOUGHTON MIFFLIN HARCOURT
Publisher:
Houghton Mifflin Harcourt
Holt Mcdougal Larson Pre-algebra: Student Edition…
Algebra
ISBN:
9780547587776
Author:
HOLT MCDOUGAL
Publisher:
HOLT MCDOUGAL
Glencoe Algebra 1, Student Edition, 9780079039897…
Algebra
ISBN:
9780079039897
Author:
Carter
Publisher:
McGraw Hill