Provide an Market Performance Ratio analysis based on P/E, ROE and D/E.

Chapter1: Financial Statements And Business Decisions
Section: Chapter Questions
Problem 1Q

Related questions
Question
100%
Provide an Market Performance Ratio analysis based on P/E, ROE and D/E.
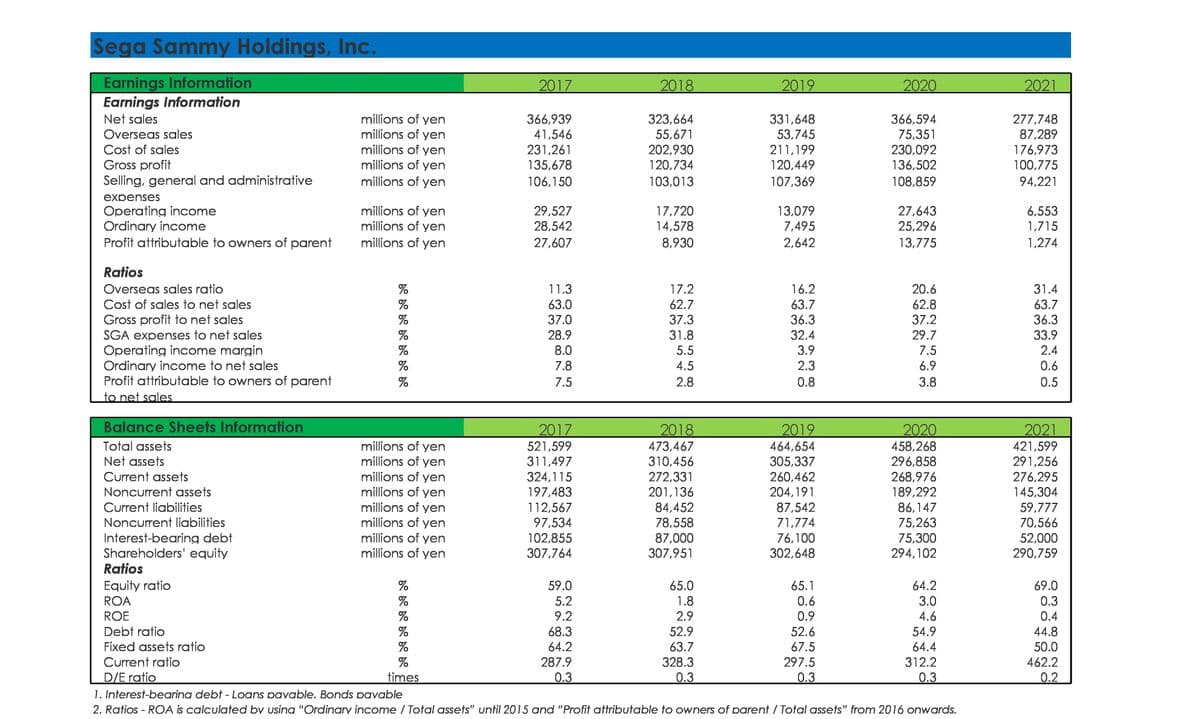
Transcribed Image Text:Sega Sammy Holdings, Inc.
Earnings Information
Earnings Information
2017
2018
2019
2020
2021
millions of yen
millions of yen
323,664
55,671
202,930
120,734
366,594
75,351
230,092
136,502
277,748
87,289
176,973
100,775
Net sales
366,939
41,546
231,261
135,678
331,648
53,745
211,199
120,449
Overseas sales
millions of yen
millions of yen
Cost of sales
Gross profit
Selling, general and administrative
millions of yen
106,150
103,013
107,369
108,859
94,221
expenses
Operating income
Ordinary income
Profit attributable to owners of parent
millions of yen
millions of yen
millions of yen
29,527
28,542
17,720
14,578
13,079
7,495
27,643
25,296
6,553
1,715
27,607
8,930
2,642
13,775
1,274
Ratios
%
%
Overseas sales ratio
11.3
17.2
16.2
20.6
31.4
Cost of sales to net sales
Gross profit to net sales
SGA expenses to net sales
Operating income margin
Ordinary income to net sales
Profit attributable to owners of parent
to net sales
63.0
62.7
63.7
62.8
63.7
%
37.0
37.3
36.3
37.2
36.3
%
28.9
31.8
32.4
29.7
33.9
8.0
5.5
3.9
7.5
2.4
7.8
4.5
2.3
6.9
0.6
7.5
2.8
0.8
3.8
0.5
Balance Sheets Information
2020
2021
421,599
2017
2018
473,467
310,456
272,331
201,136
2019
millions of yen
millions of yen
millions of yen
millions of yen
millions of yen
millions of yen
millions of yen
millions of yen
Total assets
464,654
305,337
260,462
204,191
521,599
311,497
324,115
197,483
112,567
97,534
102,855
307,764
458,268
296,858
268,976
189,292
86,147
75,263
75,300
294,102
Net assets
291,256
276,295
145,304
Current assets
Noncurrent assets
87,542
71,774
76,100
302,648
Current liabilities
84,452
78,558
87,000
307,951
59,777
70,566
52,000
290,759
Noncurrent liabilities
Interest-bearing debt
Shareholders' equity
Ratios
Equity ratio
ROA
ROE
%
59.0
65.0
1.8
65.1
64.2
69.0
5.2
9.2
0.6
3.0
0.3
%
%
2.9
0.9
4.6
0.4
Debt ratio
68.3
52.9
52.6
54.9
44.8
64.2
287.9
Fixed assets ratio
%
63.7
67.5
64.4
50.0
%
times
1. Interest-bearina debt - Loans pavable. Bonds pavable
Current ratio
D/E ratio
328.3
297.5
312.2
462.2
0.3
0.3
0.3
0.3
0.2
2. Ratios - ROA is calculated by usina "Ordinary income / Total assets" until 2015 and "Profit attributable to owners of parent / Total assets" from 2016 onwards.
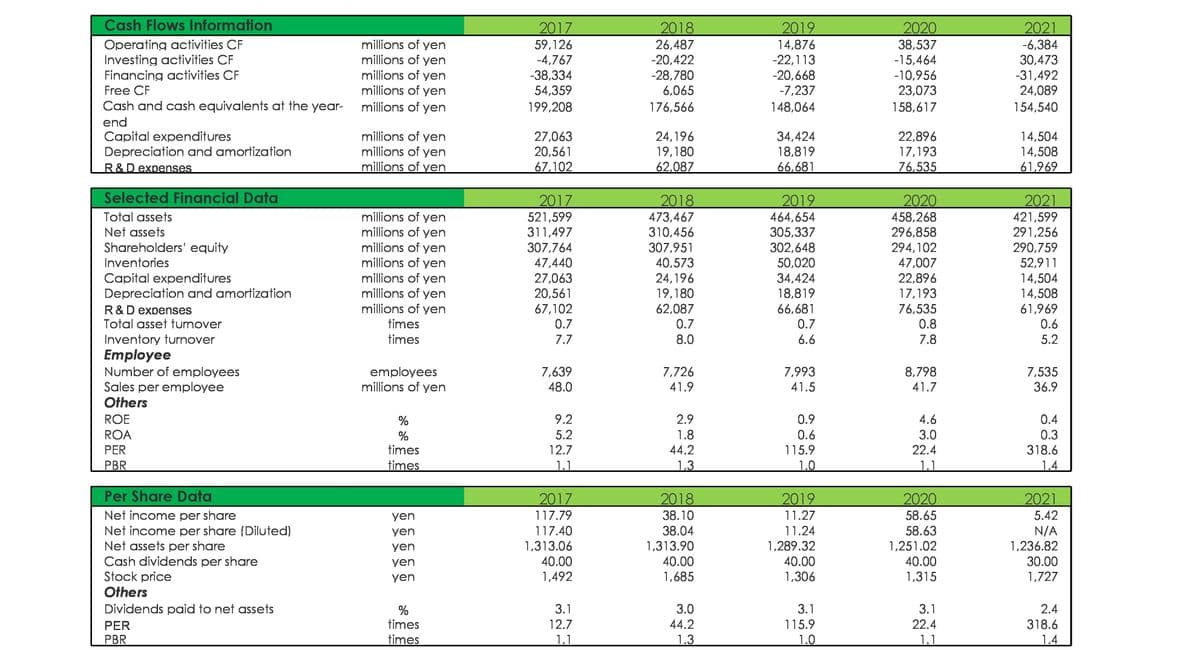
Transcribed Image Text:Cash Flows Information
2018
2019
14,876
-22,113
-20,668
2021
-6,384
30,473
-31,492
24,089
2017
2020
Operating activities CF
Investing activities CF
Financing activities CF
Free CF
Cash and cash equivalents at the year-
millions of yen
millions of yen
millions of yen
millions of yen
millions of yen
59,126
-4,767
-38,334
54,359
26,487
-20,422
-28,780
6,065
38,537
-15,464
-10,956
23,073
-7,237
199,208
176,566
148,064
158,617
154,540
end
millions of yen
millions of yen
millions of yen
14,504
Capital expenditures
Depreciation and amortization
27,063
20,561
67,102
24,196
19,180
62,087
34,424
18,819
66,681
22,896
17,193
76,535
14,508
R&D expenses
61,969
Selected Financial Data
2020
2017
521,599
311,497
307,764
47,440
27,063
20,561
2018
2019
2021
millions of yen
millions of yen
millions of yen
millions of yen
millions of yen
millions of yen
millions of yen
Total assets
Net assets
Shareholders' equity
Inventories
473,467
310,456
307,951
40,573
24,196
19,180
464,654
305,337
302,648
50,020
34,424
18,819
66,681
458,268
296,858
294,102
47,007
22,896
17,193
76,535
421,599
291,256
290,759
52,911
14,504
14,508
61,969
Capital expenditures
Depreciation and amortization
67,102
R&D expenses
Total asset turnover
62,087
0.7
times
0.7
0.7
0.8
0.6
Inventory turnover
Employee
Number of employees
Sales per employee
times
7.7
8.0
6.6
7.8
5.2
8,798
41.7
7,993
employees
millions of yen
7,639
48.0
7,726
41.9
7,535
36.9
41.5
Others
ROE
%
9.2
2.9
0.9
4.6
0.4
ROA
5.2
0.3
1.8
44.2
0.6
115.9
3.0
22.4
%
PER
times
12.7
318.6
PBR
times
1.1
1.3
1.0
1.1
1.4
Per Share Data
2017
2018
2019
2020
2021
Net income per share
Net income per share (Diluted)
Net assets per share
Cash dividends per share
Stock price
Others
yen
117.79
38.10
11.27
58.65
5.42
N/A
1,236.82
yen
117.40
38.04
11.24
58.63
1,313.06
1,251.02
1,313.90
40.00
1,289.32
40.00
yen
yen
40.00
40.00
30.00
yen
1,492
1,685
1,306
1,315
1,727
Dividends paid to net assets
3.1
3.0
3.1
3.1
22.4
2.4
%
times
318.6
1.4
12.7
44.2
115.9
PER
PBR
times
1.1
1.3
1.0
1.1
Expert Solution
This question has been solved!
Explore an expertly crafted, step-by-step solution for a thorough understanding of key concepts.

Step by step
Solved in 2 steps

Knowledge Booster


Learn more about
Need a deep-dive on the concept behind this application? Look no further. Learn more about this topic, accounting and related others by exploring similar questions and additional content below.Recommended textbooks for you

Accounting
Accounting
ISBN:
9781337272094
Author:
WARREN, Carl S., Reeve, James M., Duchac, Jonathan E.
Publisher:
Cengage Learning,

Accounting Information Systems
Accounting
ISBN:
9781337619202
Author:
Hall, James A.
Publisher:
Cengage Learning,
Accounting
Accounting
ISBN:
9781337272094
Author:
WARREN, Carl S., Reeve, James M., Duchac, Jonathan E.
Publisher:
Cengage Learning,
Accounting Information Systems
Accounting
ISBN:
9781337619202
Author:
Hall, James A.
Publisher:
Cengage Learning,

Horngren's Cost Accounting: A Managerial Emphasis…
Accounting
ISBN:
9780134475585
Author:
Srikant M. Datar, Madhav V. Rajan
Publisher:
PEARSON

Intermediate Accounting
Accounting
ISBN:
9781259722660
Author:
J. David Spiceland, Mark W. Nelson, Wayne M Thomas
Publisher:
McGraw-Hill Education

Financial and Managerial Accounting
Accounting
ISBN:
9781259726705
Author:
John J Wild, Ken W. Shaw, Barbara Chiappetta Fundamental Accounting Principles
Publisher:
McGraw-Hill Education