Q/ A College of engineering is advertised to call high school graduates to apply to its departments with criteria (Architecture not less than 90% grade, civil not less than 80% grade, mechanical not less than 70%, and electrical engineering not less than 60%). After that, 30 applicants are submitted their applications as below. Write a MATLAB program to distribute the applicants among departments according to the specified criteria using logical function and printed the results as a table, including the applicants that do not meet the criteria. Then, plot the results using two ways, first one by adding the results in one plot and the second by plot each result in one plot and place all in one figure. The plotting must includes adding (title, labels for x and y axes, legend when adding all results in one plot, control styles of lines, marker, and color styles, scaling both axes). No. 2 3 4 5 6 7 8 9 10 11 12 13 14 15 Grade 55 62 95 74 80 77 92 70 50 68 89 91 72 63 56 No. 17 22 23 24 57 93 88 25 26 27 76 66 16 18 19 20 21 28 29 30 Grade 59 97 73 74 61 85 59 89 85 98 E 15
Q/ A College of engineering is advertised to call high school graduates to apply to its departments with criteria (Architecture not less than 90% grade, civil not less than 80% grade, mechanical not less than 70%, and electrical engineering not less than 60%). After that, 30 applicants are submitted their applications as below. Write a MATLAB program to distribute the applicants among departments according to the specified criteria using logical function and printed the results as a table, including the applicants that do not meet the criteria. Then, plot the results using two ways, first one by adding the results in one plot and the second by plot each result in one plot and place all in one figure. The plotting must includes adding (title, labels for x and y axes, legend when adding all results in one plot, control styles of lines, marker, and color styles, scaling both axes). No. 2 3 4 5 6 7 8 9 10 11 12 13 14 15 Grade 55 62 95 74 80 77 92 70 50 68 89 91 72 63 56 No. 17 22 23 24 57 93 88 25 26 27 76 66 16 18 19 20 21 28 29 30 Grade 59 97 73 74 61 85 59 89 85 98 E 15

C++ for Engineers and Scientists
4th Edition
ISBN:9781133187844
Author:Bronson, Gary J.
Publisher:Bronson, Gary J.
Chapter6: Modularity Using Functions
Section: Chapter Questions
Problem 7PP: (Numerical) Heron’s formula for the area, A, of a triangle with sides of length a, b, and c is...

Related questions

Question
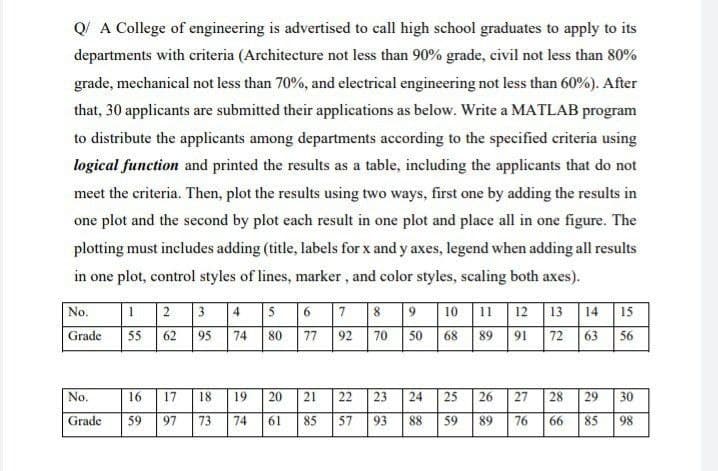
Transcribed Image Text:Q! A College of engineering is advertised to call high school graduates to apply to its
departments with criteria (Architecture not less than 90% grade, civil not less than 80%
grade, mechanical not less than 70%, and electrical engineering not less than 60%). After
that, 30 applicants are submitted their applications as below. Write a MATLAB program
to distribute the applicants among departments according to the specified criteria using
logical function and printed the results as a table, including the applicants that do not
meet the criteria. Then, plot the results using two ways, first one by adding the results in
one plot and the second by plot each result in one plot and place all in one figure. The
plotting must includes adding (title, labels for x and y axes, legend when adding all results
in one plot, control styles of lines, marker, and color styles, scaling both axes).
1 2 3 4 5 6 7 8 9 10 11 12 13 14 15
72 63 56
No.
80 77
70 50 68 89 91
Grade
55
62
95
74
92
No.
16
17
18
20 21
22
23
25
26 27
28
29
30
19
24
Grade
59
97
73
74
61
85
57
93
88
59
89
76
66
85
98
寸
Expert Solution
This question has been solved!
Explore an expertly crafted, step-by-step solution for a thorough understanding of key concepts.

Step by step
Solved in 4 steps with 5 images

Knowledge Booster


Learn more about
Need a deep-dive on the concept behind this application? Look no further. Learn more about this topic, computer-science and related others by exploring similar questions and additional content below.Recommended textbooks for you
C++ for Engineers and Scientists
Computer Science
ISBN:
9781133187844
Author:
Bronson, Gary J.
Publisher:
Course Technology Ptr
C++ for Engineers and Scientists
Computer Science
ISBN:
9781133187844
Author:
Bronson, Gary J.
Publisher:
Course Technology Ptr