Q2: A. Compute the mode choice (proportion of trips) by each of two modes (private automobile and mass transit) using the logit model and given the following information: Utility function: U, A-0.10X-0.13X:-0.12X-0.0045X, Model Parameter X, waiting time (min.) X, travel time (min.) X. parking time (min.) X4, out-of-pocket cost (cents) A. calibration constant Automobile Transit 10 35 20 225 100 0.33 -0.27
Q2: A. Compute the mode choice (proportion of trips) by each of two modes (private automobile and mass transit) using the logit model and given the following information: Utility function: U, A-0.10X-0.13X:-0.12X-0.0045X, Model Parameter X, waiting time (min.) X, travel time (min.) X. parking time (min.) X4, out-of-pocket cost (cents) A. calibration constant Automobile Transit 10 35 20 225 100 0.33 -0.27

Traffic and Highway Engineering
5th Edition
ISBN:9781305156241
Author:Garber, Nicholas J.
Publisher:Garber, Nicholas J.
Chapter4: Traffic Engineering Studies
Section: Chapter Questions
Problem 10P

Related questions
Question
None
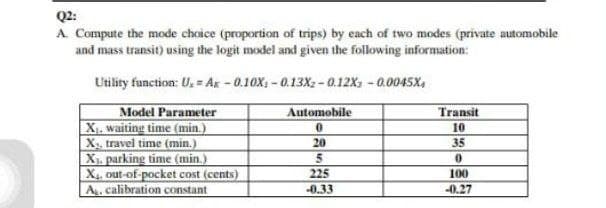
Transcribed Image Text:Q2:
A Compute the mode choice (proportion of trips) by each of two modes (private automobile
and mass transit) using the logit model and given the following information:
Utility function: U. = Ax - 0.10X, - 0.13X; -0.12X - 0.0045X,
Model Parameter
X. waiting time (min.)
Automobile
Transit
10
X, travel time (min.)
20
35
X, parking time (min.)
X4, out-of-pocket cost (cents)
A. calibration constant
225
100
0.33
-0.27
Expert Solution
This question has been solved!
Explore an expertly crafted, step-by-step solution for a thorough understanding of key concepts.

Step by step
Solved in 4 steps

Knowledge Booster


Learn more about
Need a deep-dive on the concept behind this application? Look no further. Learn more about this topic, civil-engineering and related others by exploring similar questions and additional content below.Recommended textbooks for you
Traffic and Highway Engineering
Civil Engineering
ISBN:
9781305156241
Author:
Garber, Nicholas J.
Publisher:
Cengage Learning
Traffic and Highway Engineering
Civil Engineering
ISBN:
9781305156241
Author:
Garber, Nicholas J.
Publisher:
Cengage Learning