Q2 (BREAK-EVEN ANALYSIS). An operations manager is deciding on the level of automation used to produce a new product. The fixed cost for automation includes the equipment purchase price, installation, and initial spare parts. The variable costs per unit for each level of automation are primarily labor related. Each unit can be sold for $100. If you determine that this new product will not be profitable, you can choose to not produce or sell it ($0 fixed cost, $0 variable costs). We have no forecasts/predictions about future demand. Instead, we want to know what our best automation alternative is at every possible level of demand. Assume the sale price is $100 per unit. part A part B part C part D Alternative A B с D Fixed Costs $110,000 $400,000 $600,000 $800,000 Variable Costs per Unit $60 $45 $25 $18 Calculate the break-even quantities for each alternative. If the projected demand is 2,000 units, what should you do? Plot the cost lines for each alternative and the revenue line on a single graph for quantities from 0 to 35,000. On the graph, identify the volume ranges where different alternatives are the lowest cost. NOTE: Just indicate the approximate locations of ranges and alternatives on the graph here (for calculations of the specific numbers for volume ranges, do that in part C). For each alternative, at what specific volume range is it the most attractive? If the actual realized demand is 25,000 units, what is the profit (loss) if: i) you do nothing?; ii) you choose alternative A?; iii) you choose alternative B?; iv) you choose alternative C?; iv) you choose alternative D?
Q2 (BREAK-EVEN ANALYSIS). An operations manager is deciding on the level of automation used to produce a new product. The fixed cost for automation includes the equipment purchase price, installation, and initial spare parts. The variable costs per unit for each level of automation are primarily labor related. Each unit can be sold for $100. If you determine that this new product will not be profitable, you can choose to not produce or sell it ($0 fixed cost, $0 variable costs). We have no forecasts/predictions about future demand. Instead, we want to know what our best automation alternative is at every possible level of demand. Assume the sale price is $100 per unit. part A part B part C part D Alternative A B с D Fixed Costs $110,000 $400,000 $600,000 $800,000 Variable Costs per Unit $60 $45 $25 $18 Calculate the break-even quantities for each alternative. If the projected demand is 2,000 units, what should you do? Plot the cost lines for each alternative and the revenue line on a single graph for quantities from 0 to 35,000. On the graph, identify the volume ranges where different alternatives are the lowest cost. NOTE: Just indicate the approximate locations of ranges and alternatives on the graph here (for calculations of the specific numbers for volume ranges, do that in part C). For each alternative, at what specific volume range is it the most attractive? If the actual realized demand is 25,000 units, what is the profit (loss) if: i) you do nothing?; ii) you choose alternative A?; iii) you choose alternative B?; iv) you choose alternative C?; iv) you choose alternative D?

Practical Management Science
6th Edition
ISBN:9781337406659
Author:WINSTON, Wayne L.
Publisher:WINSTON, Wayne L.
Chapter2: Introduction To Spreadsheet Modeling
Section: Chapter Questions
Problem 20P: Julie James is opening a lemonade stand. She believes the fixed cost per week of running the stand...

Related questions
Question
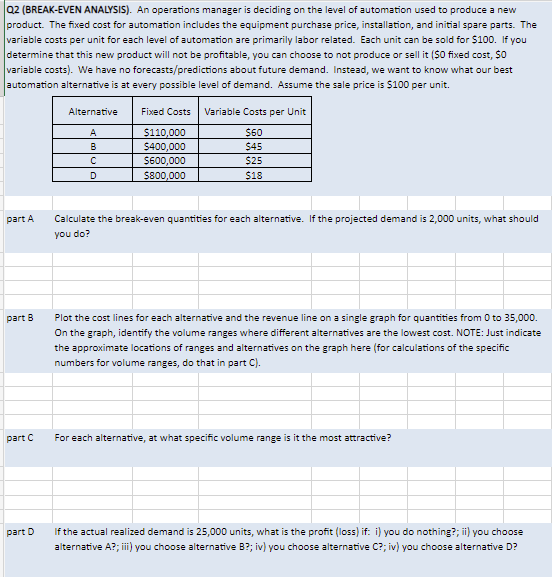
Transcribed Image Text:Q2 (BREAK-EVEN ANALYSIS). An operations manager is deciding on the level of automation used to produce a new
product. The fixed cost for automation includes the equipment purchase price, installation, and initial spare parts. The
variable costs per unit for each level of automation are primarily labor related. Each unit can be sold for $100. If you
determine that this new product will not be profitable, you can choose to not produce or sell it ($0 fixed cost, $0
variable costs). We have no forecasts/predictions about future demand. Instead, we want to know what our best
automation alternative is at every possible level of demand. Assume the sale price is $100 per unit.
part A
part B
part C
part D
Alternative
A
B
с
D
Fixed Costs
$110,000
$400,000
$600,000
$800,000
Variable Costs per Unit
$60
$45
$25
$18
Calculate the break-even quantities for each alternative. If the projected demand is 2,000 units, what should
you do?
Plot the cost lines for each alternative and the revenue line on a single graph for quantities from 0 to 35,000.
On the graph, identify the volume ranges where different alternatives are the lowest cost. NOTE: Just indicate
the approximate locations of ranges and alternatives on the graph here (for calculations of the specific
numbers for volume ranges, do that in part C).
For each alternative, at what specific volume range is it the most attractive?
If the actual realized demand is 25,000 units, what is the profit (loss) if: i) you do nothing?; ii) you choose
alternative A?; iii) you choose alternative B?; iv) you choose alternative C?; iv) you choose alternative D?
Expert Solution
This question has been solved!
Explore an expertly crafted, step-by-step solution for a thorough understanding of key concepts.

This is a popular solution!

Trending now
This is a popular solution!

Step by step
Solved in 7 steps with 11 images

Recommended textbooks for you
Practical Management Science
Operations Management
ISBN:
9781337406659
Author:
WINSTON, Wayne L.
Publisher:
Cengage,

Operations Management
Operations Management
ISBN:
9781259667473
Author:
William J Stevenson
Publisher:
McGraw-Hill Education

Operations and Supply Chain Management (Mcgraw-hi…
Operations Management
ISBN:
9781259666100
Author:
F. Robert Jacobs, Richard B Chase
Publisher:
McGraw-Hill Education
Practical Management Science
Operations Management
ISBN:
9781337406659
Author:
WINSTON, Wayne L.
Publisher:
Cengage,
Operations Management
Operations Management
ISBN:
9781259667473
Author:
William J Stevenson
Publisher:
McGraw-Hill Education
Operations and Supply Chain Management (Mcgraw-hi…
Operations Management
ISBN:
9781259666100
Author:
F. Robert Jacobs, Richard B Chase
Publisher:
McGraw-Hill Education


Purchasing and Supply Chain Management
Operations Management
ISBN:
9781285869681
Author:
Robert M. Monczka, Robert B. Handfield, Larry C. Giunipero, James L. Patterson
Publisher:
Cengage Learning

Production and Operations Analysis, Seventh Editi…
Operations Management
ISBN:
9781478623069
Author:
Steven Nahmias, Tava Lennon Olsen
Publisher:
Waveland Press, Inc.