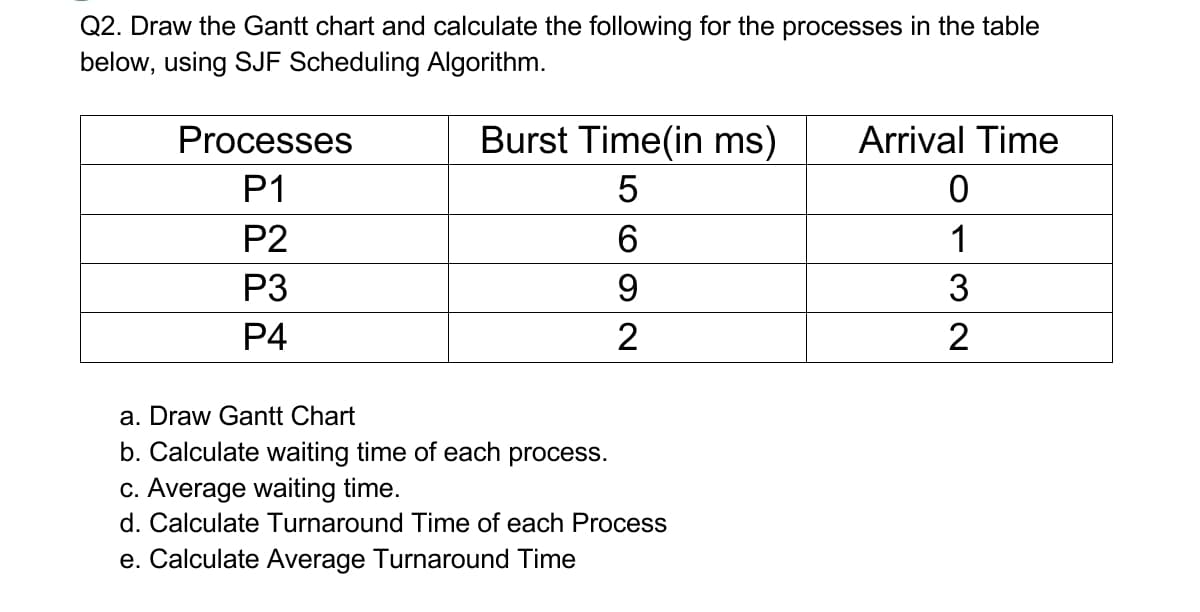
Q2. Draw the Gantt chart and calculate the following for the processes in the table below, using SJF Scheduling Algorithm. Processes Burst Time(in ms) Arrival Time P1 5 P2 1 P3 9. 3 P4 2 a. Draw Gantt Chart b. Calculate waiting time of each process. c. Average waiting time. d. Calculate Turnaround Time of each Process e. Calculate Average Turnaround Time
Q2. Draw the Gantt chart and calculate the following for the processes in the table below, using SJF Scheduling Algorithm. Processes Burst Time(in ms) Arrival Time P1 5 P2 1 P3 9. 3 P4 2 a. Draw Gantt Chart b. Calculate waiting time of each process. c. Average waiting time. d. Calculate Turnaround Time of each Process e. Calculate Average Turnaround Time

Chapter11: Operating Systems
Section: Chapter Questions
Problem 9RQ

Related questions
Question
Q2) .
Operating system
I hope that the line is clear
Transcribed Image Text:Q2. Draw the Gantt chart and calculate the following for the processes in the table
below, using SJF Scheduling Algorithm.
Processes
Burst Time(in ms)
Arrival Time
P1
P2
1
P3
9.
3
P4
2
2
a. Draw Gantt Chart
b. Calculate waiting time of each process.
c. Average waiting time.
d. Calculate Turnaround Time of each Process
e. Calculate Average Turnaround Time
Expert Solution
This question has been solved!
Explore an expertly crafted, step-by-step solution for a thorough understanding of key concepts.

Step by step
Solved in 3 steps

Knowledge Booster


Learn more about
Need a deep-dive on the concept behind this application? Look no further. Learn more about this topic, computer-science and related others by exploring similar questions and additional content below.Recommended textbooks for you
Systems Architecture
Computer Science
ISBN:
9781305080195
Author:
Stephen D. Burd
Publisher:
Cengage Learning
Systems Architecture
Computer Science
ISBN:
9781305080195
Author:
Stephen D. Burd
Publisher:
Cengage Learning