The graphs below show water levels over the course of a lunar mohth. exposed to the most air if they live between which tide markings? Neap tide -Spring tide Time Water Level
The graphs below show water levels over the course of a lunar mohth. exposed to the most air if they live between which tide markings? Neap tide -Spring tide Time Water Level

Related questions
Question
100%
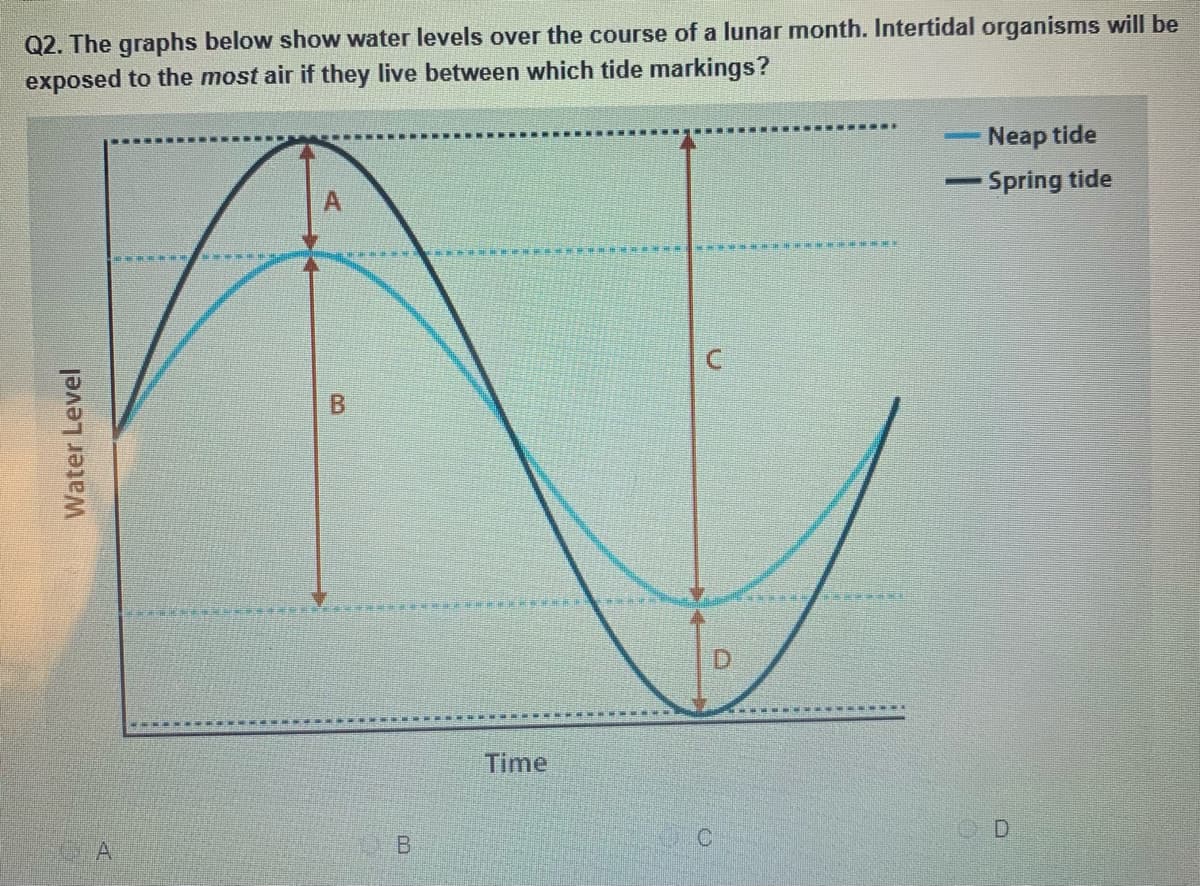
Transcribed Image Text:Q2. The graphs below show water levels over the course of a lunar month. Intertidal organisms will be
exposed to the most air if they live between which tide markings?
Neap tide
Spring tide
|
Time
A
B.
Water Level
B.
Expert Solution
This question has been solved!
Explore an expertly crafted, step-by-step solution for a thorough understanding of key concepts.

This is a popular solution!

Trending now
This is a popular solution!

Step by step
Solved in 2 steps
