Q2. Using MS-Excel, make a table for n=1 to 10 and generate a graph to show how the following functions grow. Using the table and the graph, determine which function grows faster. a. n log n b. n c. log(n+1) d. 15 log n e. an
Q2. Using MS-Excel, make a table for n=1 to 10 and generate a graph to show how the following functions grow. Using the table and the graph, determine which function grows faster. a. n log n b. n c. log(n+1) d. 15 log n e. an

Chapter6: Exponential And Logarithmic Functions
Section6.8: Fitting Exponential Models To Data
Problem 60SE: Use the result from the previous exercise to graph the logistic model P(t)=201+4e0.5t along with its...

Related questions
Question
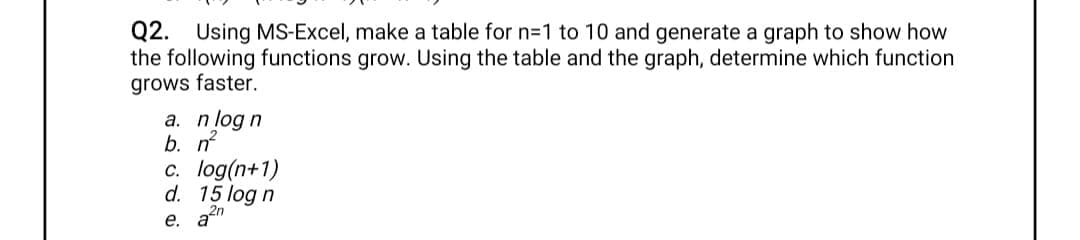
Transcribed Image Text:Q2. Using MS-Excel, make a table for n=1 to 10 and generate a graph to show how
the following functions grow. Using the table and the graph, determine which function
grows faster.
а. п/og n
b. n
c. log(n+1)
d. 15 log n
e. a2n
Expert Solution
This question has been solved!
Explore an expertly crafted, step-by-step solution for a thorough understanding of key concepts.

Step by step
Solved in 8 steps with 3 images

Recommended textbooks for you

Algebra and Trigonometry (MindTap Course List)
Algebra
ISBN:
9781305071742
Author:
James Stewart, Lothar Redlin, Saleem Watson
Publisher:
Cengage Learning

Algebra & Trigonometry with Analytic Geometry
Algebra
ISBN:
9781133382119
Author:
Swokowski
Publisher:
Cengage
Algebra and Trigonometry (MindTap Course List)
Algebra
ISBN:
9781305071742
Author:
James Stewart, Lothar Redlin, Saleem Watson
Publisher:
Cengage Learning
Algebra & Trigonometry with Analytic Geometry
Algebra
ISBN:
9781133382119
Author:
Swokowski
Publisher:
Cengage

College Algebra
Algebra
ISBN:
9781305115545
Author:
James Stewart, Lothar Redlin, Saleem Watson
Publisher:
Cengage Learning