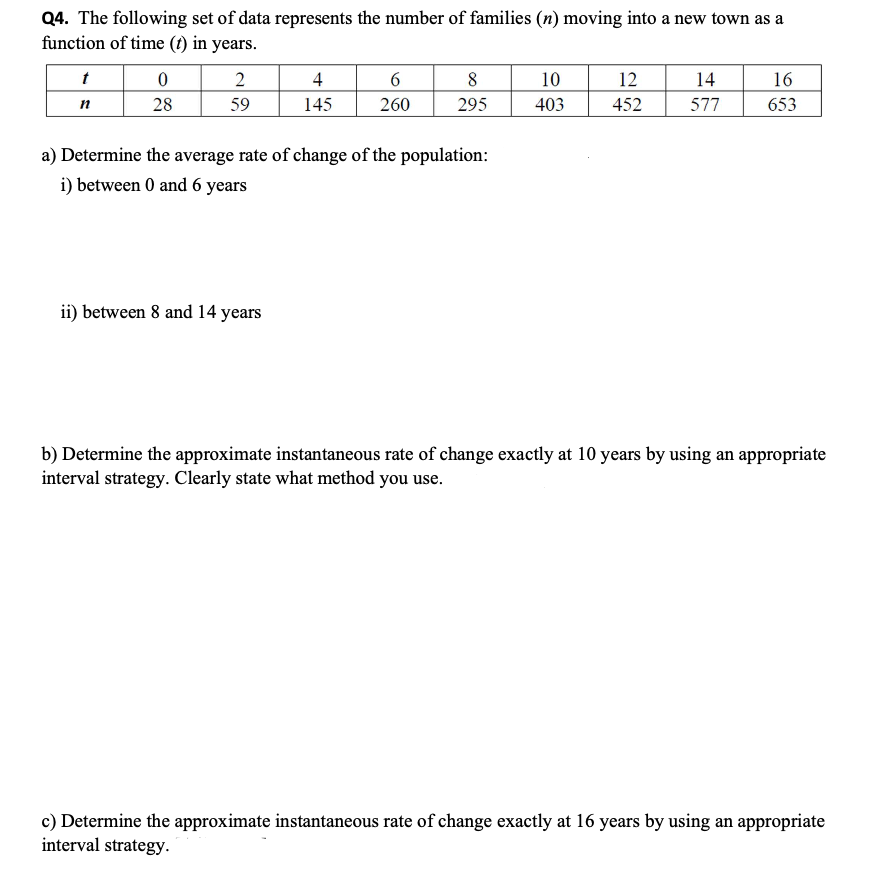
Q4. The following set of data represents the number of families (n) moving into a new town as a function of time (t) in years. 4 8 10 12 14 16 28 59 145 260 295 403 452 577 653 n a) Determine the average rate of change of the population: i) between 0 and 6 years ii) between 8 and 14 years b) Determine the approximate instantaneous rate of change exactly at 10 years by using an appropriate interval strategy. Clearly state what method you use.
Q4. The following set of data represents the number of families (n) moving into a new town as a function of time (t) in years. 4 8 10 12 14 16 28 59 145 260 295 403 452 577 653 n a) Determine the average rate of change of the population: i) between 0 and 6 years ii) between 8 and 14 years b) Determine the approximate instantaneous rate of change exactly at 10 years by using an appropriate interval strategy. Clearly state what method you use.

Trigonometry (MindTap Course List)
10th Edition
ISBN:9781337278461
Author:Ron Larson
Publisher:Ron Larson
Chapter6: Topics In Analytic Geometry
Section: Chapter Questions
Problem 33CT

Related questions
Question
Kindly answer all the questions in the image, much appreciated.
Transcribed Image Text:Q4. The following set of data represents the number of families (n) moving into a new town as a
function of time (t) in years.
2
4
6
10
12
14
16
n
28
59
145
260
295
403
452
577
653
a) Determine the average rate of change of the population:
i) between 0 and 6 years
ii) between 8 and 14 years
b) Determine the approximate instantaneous rate of change exactly at 10 years by using an appropriate
interval strategy. Clearly state what method you use.
c) Determine the approximate instantaneous rate of change exactly at 16 years by using an appropriate
interval strategy.
Expert Solution
This question has been solved!
Explore an expertly crafted, step-by-step solution for a thorough understanding of key concepts.

Step by step
Solved in 2 steps with 2 images

Recommended textbooks for you
Trigonometry (MindTap Course List)
Trigonometry
ISBN:
9781337278461
Author:
Ron Larson
Publisher:
Cengage Learning

Trigonometry (MindTap Course List)
Trigonometry
ISBN:
9781337278461
Author:
Ron Larson
Publisher:
Cengage Learning