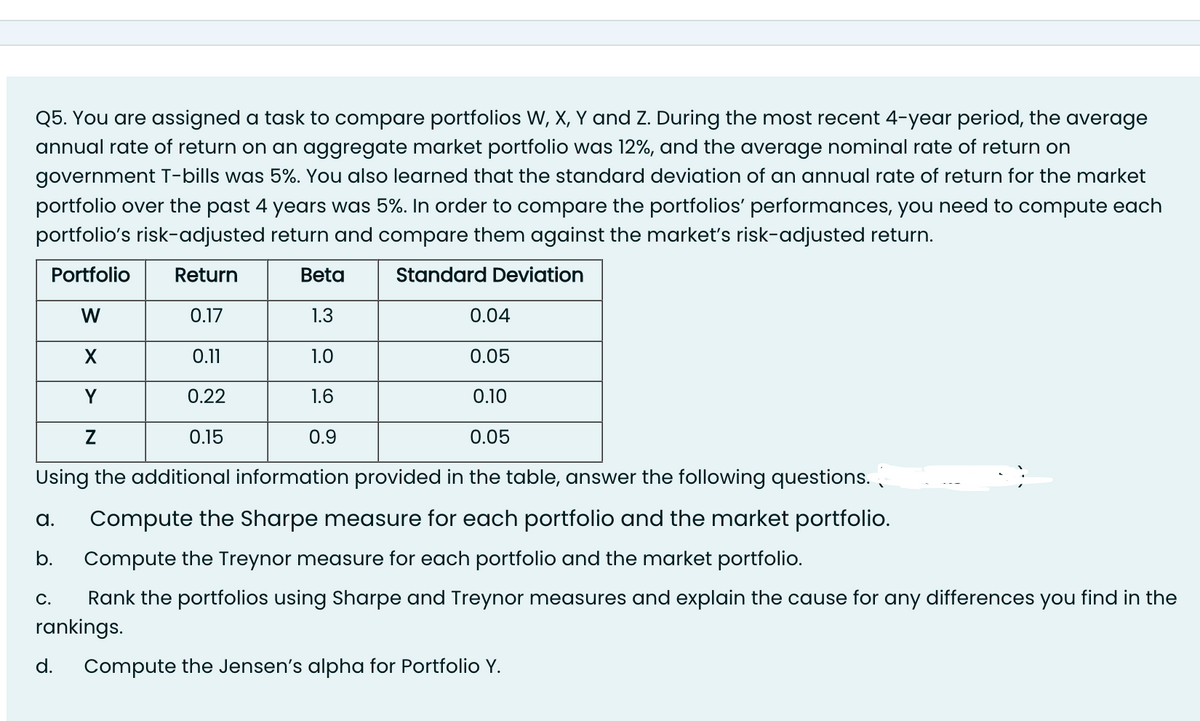
Q5. You are assigned a task to compare portfolios W, X, Y and Z. During the most recent 4-year period, the average annual rate of return on an aggregate market portfolio was 12%, and the average nominal rate of return on government T-bills was 5%. You also learned that the standard deviation of an annual rate of return for the market portfolio over the past 4 years was 5%. In order to compare the portfolios' performances, you need to compute each portfolio's risk-adjusted return and compare them against the market's risk-adjusted return. Portfolio Return Beta Standard Deviation W 0.17 1.3 X 0.11 1.0 Y 0.22 1.6 Z 0.15 0.9 0.04 0.05 0.10 0.05 Using the additional information provided in the table, answer the following questions. Compute the Sharpe measure for each portfolio and the market portfolio. Compute the Treynor measure for each portfolio and the market portfolio. Rank the portfolios using Sharpe and Treynor measures and explain the cause for any differences you find in the rankings. a. b. C. d. Compute the Jensen's alpha for Portfolio Y.
Q5. You are assigned a task to compare portfolios W, X, Y and Z. During the most recent 4-year period, the average annual rate of return on an aggregate market portfolio was 12%, and the average nominal rate of return on government T-bills was 5%. You also learned that the standard deviation of an annual rate of return for the market portfolio over the past 4 years was 5%. In order to compare the portfolios' performances, you need to compute each portfolio's risk-adjusted return and compare them against the market's risk-adjusted return. Portfolio Return Beta Standard Deviation W 0.17 1.3 X 0.11 1.0 Y 0.22 1.6 Z 0.15 0.9 0.04 0.05 0.10 0.05 Using the additional information provided in the table, answer the following questions. Compute the Sharpe measure for each portfolio and the market portfolio. Compute the Treynor measure for each portfolio and the market portfolio. Rank the portfolios using Sharpe and Treynor measures and explain the cause for any differences you find in the rankings. a. b. C. d. Compute the Jensen's alpha for Portfolio Y.

Chapter8: Analysis Of Risk And Return
Section: Chapter Questions
Problem 15P

Related questions

Concept explainers
Risk and return
Before understanding the concept of Risk and Return in Financial Management, understanding the two-concept Risk and return individually is necessary.
Capital Asset Pricing Model
Capital asset pricing model, also known as CAPM, shows the relationship between the expected return of the investment and the market at risk. This concept is basically used particularly in the case of stocks or shares. It is also used across finance for pricing assets that have higher risk identity and for evaluating the expected returns for the assets given the risk of those assets and also the cost of capital.
Question
Transcribed Image Text:Q5. You are assigned a task to compare portfolios W, X, Y and Z. During the most recent 4-year period, the average
annual rate of return on an aggregate market portfolio was 12%, and the average nominal rate of return on
government T-bills was 5%. You also learned that the standard deviation of an annual rate of return for the market
portfolio over the past 4 years was 5%. In order to compare the portfolios' performances, you need to compute each
portfolio's risk-adjusted return and compare them against the market's risk-adjusted return.
Portfolio
Return
Standard Deviation
W
0.17
X
0.11
Y
0.22
Z
0.15
0.04
0.05
0.10
0.05
Using the additional information provided in the table, answer the following questions.
Compute the Sharpe measure for each portfolio and the market portfolio.
Compute the Treynor measure for each portfolio and the market portfolio.
Rank the portfolios using Sharpe and Treynor measures and explain the cause for any differences you find in the
rankings.
a.
b.
C.
Beta
1.3
1.0
1.6
0.9
d.
Compute the Jensen's alpha for Portfolio Y.
Expert Solution
This question has been solved!
Explore an expertly crafted, step-by-step solution for a thorough understanding of key concepts.

Step by step
Solved in 6 steps

Knowledge Booster


Learn more about
Need a deep-dive on the concept behind this application? Look no further. Learn more about this topic, finance and related others by exploring similar questions and additional content below.Recommended textbooks for you
EBK CONTEMPORARY FINANCIAL MANAGEMENT
Finance
ISBN:
9781337514835
Author:
MOYER
Publisher:
CENGAGE LEARNING - CONSIGNMENT


Intermediate Financial Management (MindTap Course…
Finance
ISBN:
9781337395083
Author:
Eugene F. Brigham, Phillip R. Daves
Publisher:
Cengage Learning
EBK CONTEMPORARY FINANCIAL MANAGEMENT
Finance
ISBN:
9781337514835
Author:
MOYER
Publisher:
CENGAGE LEARNING - CONSIGNMENT
Intermediate Financial Management (MindTap Course…
Finance
ISBN:
9781337395083
Author:
Eugene F. Brigham, Phillip R. Daves
Publisher:
Cengage Learning

Essentials of Business Analytics (MindTap Course …
Statistics
ISBN:
9781305627734
Author:
Jeffrey D. Camm, James J. Cochran, Michael J. Fry, Jeffrey W. Ohlmann, David R. Anderson
Publisher:
Cengage Learning
