Question 1 Quadratic models are used to represent situations that have motion. For example, throwing a ball, riding the loop of a roller coaster, accelerating in your car. All of these examples, when graphed would create graphs with a parabolic shape (like a U or upside U). Quadratic equations have the form y = As with linear models, y represents the and x represents the variable (on the vertical axis) variable (on the horizontal axis). but we can still use their equation to Quadratic models do not have a make predictions and estimates. As we did with linear models, we are going to use Excel to find a "quadratic" trendlines.
Question 1 Quadratic models are used to represent situations that have motion. For example, throwing a ball, riding the loop of a roller coaster, accelerating in your car. All of these examples, when graphed would create graphs with a parabolic shape (like a U or upside U). Quadratic equations have the form y = As with linear models, y represents the and x represents the variable (on the vertical axis) variable (on the horizontal axis). but we can still use their equation to Quadratic models do not have a make predictions and estimates. As we did with linear models, we are going to use Excel to find a "quadratic" trendlines.

Big Ideas Math A Bridge To Success Algebra 1: Student Edition 2015
1st Edition
ISBN:9781680331141
Author:HOUGHTON MIFFLIN HARCOURT
Publisher:HOUGHTON MIFFLIN HARCOURT
Chapter11: Data Analysis And Displays
Section: Chapter Questions
Problem 12CR

Related questions
Question
Transcribed Image Text:Question 1
Quadratic models are used to represent situations that have
motion. For example, throwing a ball, riding the loop of a roller coaster, accelerating in
your car. All of these examples, when graphed would create graphs with a parabolic
shape (like a U or upside U).
Quadratic equations have the form y =
As with linear models, y represents the
and x represents the
Quadratic models do not have a
make predictions and estimates.
variable (on the horizontal axis).
but we can still use their equation to
variable (on the vertical axis)
As we did with linear models, we are going to use Excel to find a "quadratic" trendlines.
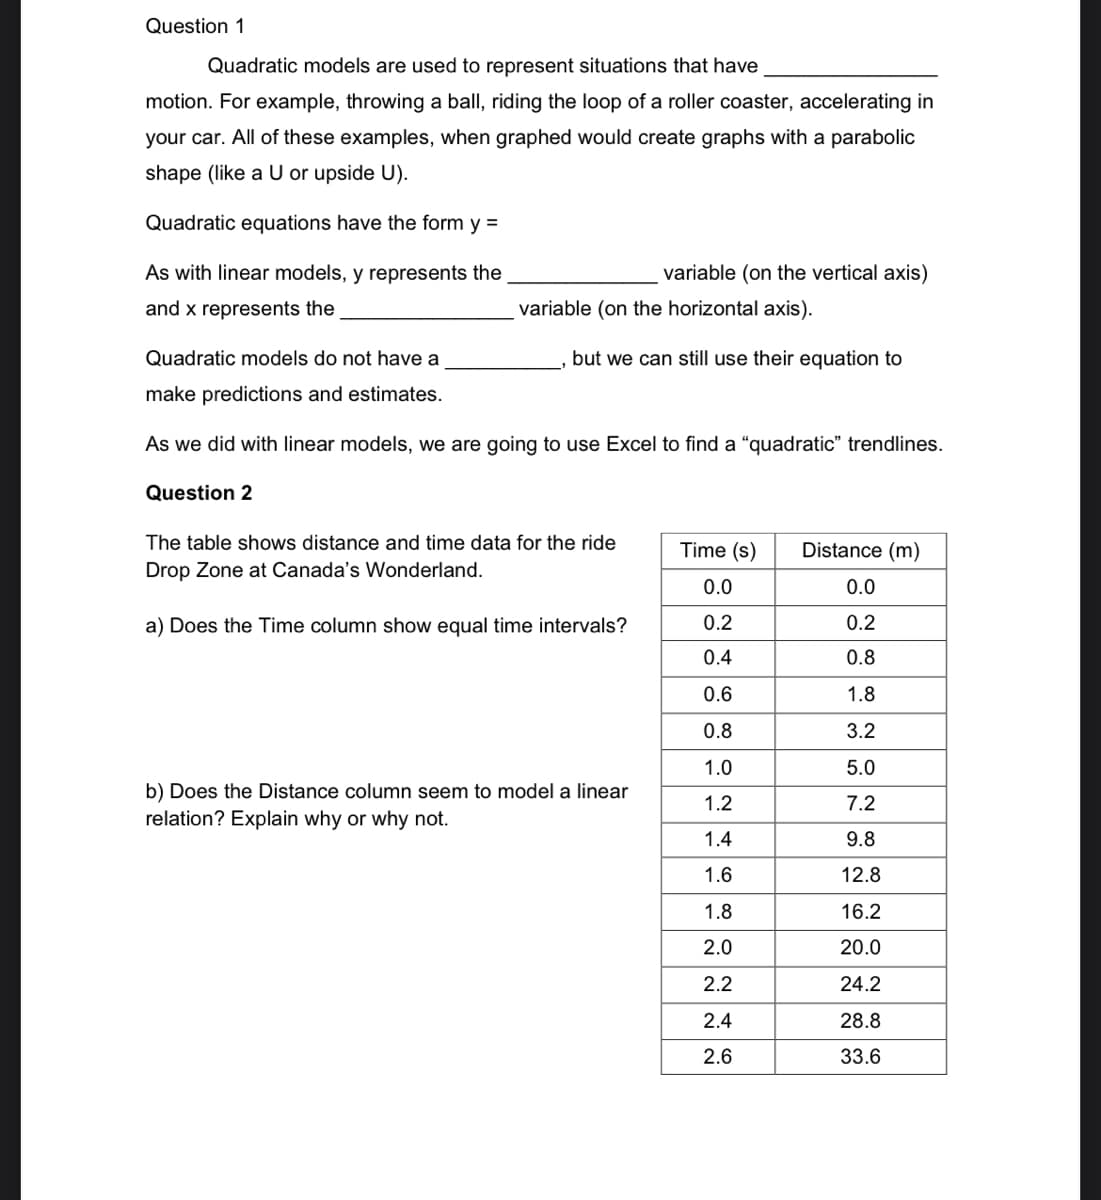
Question 2
The table shows distance and time data for the ride
Drop Zone at Canada's Wonderland.
a) Does the Time column show equal time intervals?
b) Does the Distance column seem to model a linear
relation? Explain why or why not.
Time (s) Distance (m)
0.0
0.0
0.2
0.2
0.4
0.8
0.6
1.8
0.8
3.2
1.0
5.0
1.2
7.2
1.4
9.8
1.6
12.8
1.8
16.2
2.0
20.0
2.2
24.2
2.4
28.8
2.6
33.6
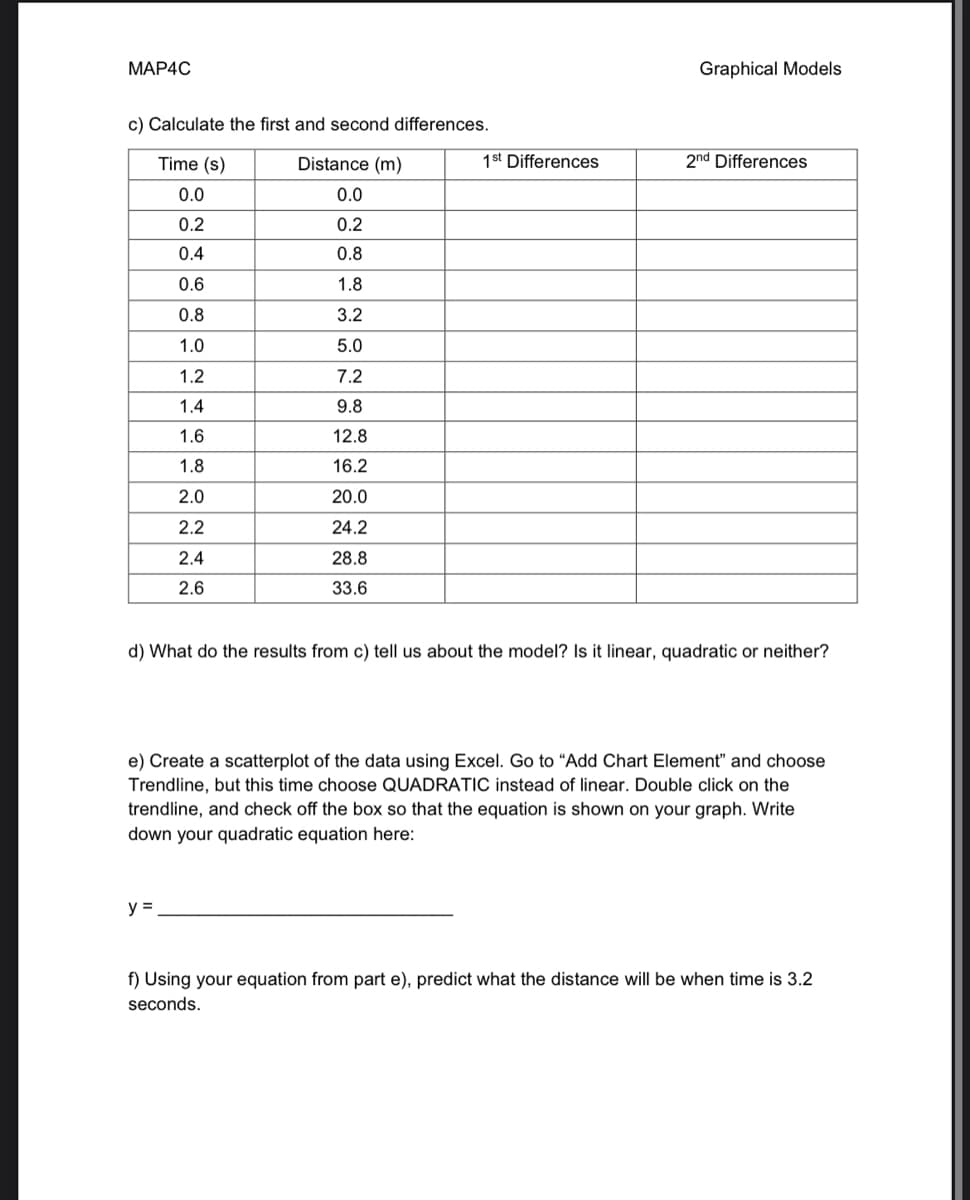
Transcribed Image Text:MAP4C
c) Calculate the first and second differences.
Time (s)
0.0
0.2
0.4
0.6
0.8
1.0
1.2
1.4
1.6
1.8
2.0
2.2
2.4
2.6
Distance (m)
0.0
0.2
0.8
1.8
3.2
5.0
7.2
9.8
12.8
16.2
20.0
24.2
28.8
33.6
y =
1st Differences
Graphical Models
2nd Differences
d) What do the results from c) tell us about the model? Is it linear, quadratic or neither?
e) Create a scatterplot of the data using Excel. Go to "Add Chart Element" and choose
Trendline, but this time choose QUADRATIC instead of linear. Double click on the
trendline, and check off the box so that the equation is shown on your graph. Write
down your quadratic equation here:
f) Using your equation from part e), predict what the distance will be when time is 3.2
seconds.
Expert Solution
This question has been solved!
Explore an expertly crafted, step-by-step solution for a thorough understanding of key concepts.

Step by step
Solved in 3 steps

Recommended textbooks for you
Big Ideas Math A Bridge To Success Algebra 1: Stu…
Algebra
ISBN:
9781680331141
Author:
HOUGHTON MIFFLIN HARCOURT
Publisher:
Houghton Mifflin Harcourt

Algebra & Trigonometry with Analytic Geometry
Algebra
ISBN:
9781133382119
Author:
Swokowski
Publisher:
Cengage
Big Ideas Math A Bridge To Success Algebra 1: Stu…
Algebra
ISBN:
9781680331141
Author:
HOUGHTON MIFFLIN HARCOURT
Publisher:
Houghton Mifflin Harcourt
Algebra & Trigonometry with Analytic Geometry
Algebra
ISBN:
9781133382119
Author:
Swokowski
Publisher:
Cengage