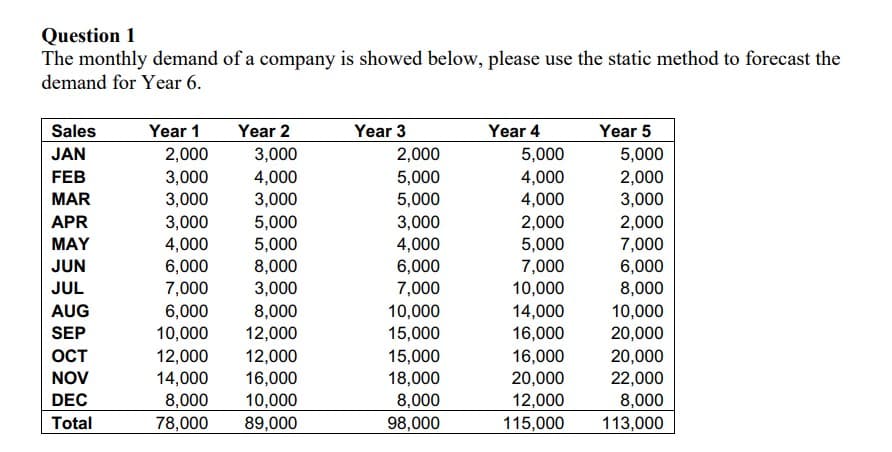
Question 1 The monthly demand of a company is showed below, please use the static method to forecast the demand for Year 6. Sales Year 1 Year 2 Year 3 Year 4 Year 5 JAN 2,000 3,000 2,000 5,000 5,000 FEB 3,000 4,000 5,000 4,000 2,000 MAR 3,000 3,000 5,000 4,000 3,000 APR 3,000 5,000 3,000 2,000 2,000 MAY 4,000 5,000 4,000 5,000 7,000 JUN 6,000 8,000 6,000 7,000 6,000 JUL 7,000 3,000 7,000 10,000 8,000 AUG 6,000 8,000 10,000 14,000 10,000 SEP 10,000 12,000 15,000 16,000 20,000 OCT 12,000 12,000 15,000 16,000 20,000 NOV 14,000 16,000 18,000 20,000 22,000 DEC 8,000 10,000 8,000 12,000 8,000 Total 78,000 89,000 98,000 115,000 113,000


Q: The president of a small manufacturing firm is concerned about the continual growth in manufacturing…
A: Find the given details below:Note that, for the first question the mentioned graphs are not…
Q: For the remaining questions, consider the following problem description: An oil company is…
A: This question belongs to the field of Operations Research, particularly in the area of optimization…
Q: Management of Mittel Rhein AG of Köln, Germany, would like to reduce the amount of time between when…
A: Throughput time is the amount of time needed to finish the production process from the raw material…
Q: How can companies use market research to validate and refine their value propositions?
A: Market research serves as a vital tool for companies seeking to validate and refine their value…
Q: As extracted from the case study, “the pandemic resulted in disrupted deliveries and many other…
A: The objective of the question is to identify and evaluate the measures and strategies that the…
Q: Please explain results for section c) Task assignment
A: Here, for each work element, I am given the time data, and immediate predecessor data, I am also…
Q: Compute the reliability of the bridge system as shown in Figure 1. If the omponent reliability is R₁…
A: Reliability refers to the probability that a system, component, or process will perform its intended…
Q: Baker Manufacturing Company forecasts the following demand for a product (in thousands of units)…
A: Capacity planning is a strategic process used by business organisations to determine the optimal…
Q: How does outsourcing affect a company's design capacity calculations?
A: In the context of capacity planning, an organization's design capacity is its maximum ability to…
Q: PLEASE HELP with correct answers A statistical program is recommended. The quarterly sales data…
A: To compute the quarterly forecasts for Year 4 using the equation provided, you will need to…
Q: 1. Read The decision-making tree - A simple way to visualize a decision. Optional: also read The…
A: A decision is a choice made from two or more alternatives.Decision making is a process which…
Q: In jazz composition/arranging, the composer takes all the written material of the arranger, and…
A: In jazz composition/arranging, the composer takes all the written material of the arranger, and…
Q: Your company has developed a new energy drink and you are trying to decide whether to sell the…
A: Find the given details below:
Q: supply
A: A supply chain is an arrangement of interdependent systems, resources, capacities, and technologies…
Q: All airplane passengers at the Lake City Regional Airport must pass through a security screening…
A: Given data:Arrival rate (λ) = 8 passengers per minuteService rate (μ) = 5 passengers per minuteThere…
Q: The owner of Artisanal Chips etc. produces three flavors of artisanal corn chips marketed at new…
A: The information regarding production of 3 products: pumpkin (P), chipotle adobo (C) and basement (B)…
Q: _____ is the level of necessaries, comforts, and luxuries that a person is accustomed to enjoying.…
A: Standard of living Explanation:The level of material comfort and well-being that people or groups…
Q: Which statement is accurate regarding the strategic contingency model? Group of answer choices If…
A: The strategic contingency model is a perspective of organizational behavior that suggests that…
Q: The manager of the Oak Hills Swimming Club is planning the club’s swimming team program. The first…
A: PERT which stands for Programme Evaluation and Review Technique is a project management tool used…
Q: Quality management is the process of ensuring that products or services meet or exceed customer…
A: Operation management is an aspect of management that deals with the management of the production,…
Q: Analyse the internal and external environments impacting the Trans-Africa Projects. Demonstrate an…
A: To analyse the internal and external environments impacting Trans-Africa Projects, we'll conduct an…
Q: Consider the following transshipment network for finding the shortest route from node 1 to node 7.…
A: A transhipment problem is given below:
Q: You are a Quality Manager for a very well-known food ingredient company that produces monosodium…
A: process mean is μ = 2018 g,Variation σ = 16 gSample bags = 8
Q: For the data below, answer the following four questions: Period Demand 1 58 59 60 61 What would be…
A: Forecasting is done to predict the actuals in the upcoming periods .There are several quantitative…
Q: Consider the following all-integer linear program. 5xy + 8x2 Max s.t. 6x₁ + 5x₂ ≤ 35 10x₂ + 4x₂ ≤ 40…
A: Objective Functions and Constraints:Objective Function:Constraints:Subject to
Q: Project Management Homework-Project Crashing Use the following scenario and data to answer all…
A: Question 3: Cost of Crashing Activity D by One WeekAnswer: 600Here's how we find the cost of…
Q: Construct the dual of this LP and solve it using the Simplex method. 60x1 2x1 3x1 5x1 + 20x2 + 10x3…
A:
Q: Explain how to respond to the busing of immigrants to sanctuary cities situation and the ethical…
A: Responding to the busing of immigrants to sanctuary cities situation requires a comprehensive…
Q: In time study, the rating factor is applied to determine a)standard time of a job b)merit rating of…
A: In time study, a rating factor is applied to adjust the observed time to standardize the measurement…
Q: Annual demand for products A, B and C at Widgets Manufacturing is 6000, 3000, and 500 units…
A: To calculate the mixed model minimum batch size, we need to consider the annual demand for each…
Q: 14. Describe how strategic planning is different from long- range planning.
A: Planning is the aspect of management that assists an individual in forecasting the future and making…
Q: The production scheduler of Scotsburn Dairy in Truro, NS, has just received a list of products and…
A: To sequence the manufacturing of these products, the production scheduler must consider a number of…
Q: 4. The Spencer Optics Company produces an inexpensive line of sunglasses. The manufacturing process…
A: SOLUTIONGiven Informationlet's break down the informationBy the using these excel formulas in the…
Q: Assume an initial starting Ft of 200 units, a trend (Tt ) of 8 units, an alpha of 0.30, and a delta…
A: C 208Explanation:
Q: Suppose a manufacturer of copiers has concluded that a 70 percent learning curve applies to the time…
A: A learning curve is a graphical representation that shows how an increase in learning (measured on…
Q: What is operational research
A: Management specifically the art of doing things by others every organization has its management for…
Q: How do organizations balance the need for automation with human labor in production management?
A: Production management is a set of activities that include planning, coordinating, monitoring,…
Q: A warehouse storage building company must determine how many storage sheds of each size-large or…
A: Linear programming is a mathematical method used to find the best possible outcome or solution from…
Q: What did the Milgram experiment on conformity to authority reveal to researchers? Group of answer…
A: The Milgram experiment was a series of social psychology experiments conducted by Yale University…
Q: TipTop Snowboards in Beech Mountain, NC sell a popular snowboard during the winter ski season. The…
A: The anticipated demand is normally distributed with mean =731 units and standard deviation =431…
Q: 2.9 A company wants to develop a level production plan. The beginning inventory is zero. Demand for…
A: Find the given details below:
Q: Choose a business of your own wish and draw a supply chain and list the key components. Post the…
A: Operation management is an aspect of management that deals with the management of the production,…
Q: Project Management Homework-Project Crashing Use the following scenario and data to answer all…
A: To address the problem given in the images, we need to complete the cost per week for crashing each…
Q: What is the general plan for the first joint negotiations in the mediator’s presence? How will…
A: Human resource management is the aspect of management that is concerned with managing, supporting,…
Q: Considering the scenario below, answer the following questions: What constraints and options for…
A: **Constraints and Options for Kelly Connor:** 1. **Time Constraints:** Kelly is constrained by her…
Q: Quality Function Deployment (QFD) is a structured approach that helps translate customer…
A: A quality function deployment or QFD is a structured methodological procedure that helps to…
Q: Completing a Bank Reconciliation. Supplies Needed: Copy of Figure 4; Bank Statement; Bank…
A: Dear student, find a detailed answer and step by step solution in the explanation part…
Q: Given the table below: Activity A B C D E F G H I Dependency A A A B B,C C,D FG E,F,H Duration…
A: Find the given details below:
Q: Calculate the reorder level 1. Calculate the maximum level of inventory 2. Calculate the minimum…
A: Inventory management is a part of managing the organization wherein goods are produced. It helps in…
Q: A team of workers makes 400 units of a product, which is sold in the market for $11 each. The…
A: The objective of this question is to calculate the productivity of a team operation in terms of…


Trending now
This is a popular solution!

Step by step
Solved in 1 steps with 8 images

- Scenario 4 Sharon Gillespie, a new buyer at Visionex, Inc., was reviewing quotations for a tooling contract submitted by four suppliers. She was evaluating the quotes based on price, target quality levels, and delivery lead time promises. As she was working, her manager, Dave Cox, entered her office. He asked how everything was progressing and if she needed any help. She mentioned she was reviewing quotations from suppliers for a tooling contract. Dave asked who the interested suppliers were and if she had made a decision. Sharon indicated that one supplier, Apex, appeared to fit exactly the requirements Visionex had specified in the proposal. Dave told her to keep up the good work. Later that day Dave again visited Sharons office. He stated that he had done some research on the suppliers and felt that another supplier, Micron, appeared to have the best track record with Visionex. He pointed out that Sharons first choice was a new supplier to Visionex and there was some risk involved with that choice. Dave indicated that it would please him greatly if she selected Micron for the contract. The next day Sharon was having lunch with another buyer, Mark Smith. She mentioned the conversation with Dave and said she honestly felt that Apex was the best choice. When Mark asked Sharon who Dave preferred, she answered, Micron. At that point Mark rolled his eyes and shook his head. Sharon asked what the body language was all about. Mark replied, Look, I know youre new but you should know this. I heard last week that Daves brother-in-law is a new part owner of Micron. I was wondering how soon it would be before he started steering business to that company. He is not the straightest character. Sharon was shocked. After a few moments, she announced that her original choice was still the best selection. At that point Mark reminded Sharon that she was replacing a terminated buyer who did not go along with one of Daves previous preferred suppliers. Ethical decisions that affect a buyers ethical perspective usually involve the organizational environment, cultural environment, personal environment, and industry environment. Analyze this scenario using these four variables.Scenario 4 Sharon Gillespie, a new buyer at Visionex, Inc., was reviewing quotations for a tooling contract submitted by four suppliers. She was evaluating the quotes based on price, target quality levels, and delivery lead time promises. As she was working, her manager, Dave Cox, entered her office. He asked how everything was progressing and if she needed any help. She mentioned she was reviewing quotations from suppliers for a tooling contract. Dave asked who the interested suppliers were and if she had made a decision. Sharon indicated that one supplier, Apex, appeared to fit exactly the requirements Visionex had specified in the proposal. Dave told her to keep up the good work. Later that day Dave again visited Sharons office. He stated that he had done some research on the suppliers and felt that another supplier, Micron, appeared to have the best track record with Visionex. He pointed out that Sharons first choice was a new supplier to Visionex and there was some risk involved with that choice. Dave indicated that it would please him greatly if she selected Micron for the contract. The next day Sharon was having lunch with another buyer, Mark Smith. She mentioned the conversation with Dave and said she honestly felt that Apex was the best choice. When Mark asked Sharon who Dave preferred, she answered, Micron. At that point Mark rolled his eyes and shook his head. Sharon asked what the body language was all about. Mark replied, Look, I know youre new but you should know this. I heard last week that Daves brother-in-law is a new part owner of Micron. I was wondering how soon it would be before he started steering business to that company. He is not the straightest character. Sharon was shocked. After a few moments, she announced that her original choice was still the best selection. At that point Mark reminded Sharon that she was replacing a terminated buyer who did not go along with one of Daves previous preferred suppliers. What should Sharon do in this situation?Scenario 4 Sharon Gillespie, a new buyer at Visionex, Inc., was reviewing quotations for a tooling contract submitted by four suppliers. She was evaluating the quotes based on price, target quality levels, and delivery lead time promises. As she was working, her manager, Dave Cox, entered her office. He asked how everything was progressing and if she needed any help. She mentioned she was reviewing quotations from suppliers for a tooling contract. Dave asked who the interested suppliers were and if she had made a decision. Sharon indicated that one supplier, Apex, appeared to fit exactly the requirements Visionex had specified in the proposal. Dave told her to keep up the good work. Later that day Dave again visited Sharons office. He stated that he had done some research on the suppliers and felt that another supplier, Micron, appeared to have the best track record with Visionex. He pointed out that Sharons first choice was a new supplier to Visionex and there was some risk involved with that choice. Dave indicated that it would please him greatly if she selected Micron for the contract. The next day Sharon was having lunch with another buyer, Mark Smith. She mentioned the conversation with Dave and said she honestly felt that Apex was the best choice. When Mark asked Sharon who Dave preferred, she answered, Micron. At that point Mark rolled his eyes and shook his head. Sharon asked what the body language was all about. Mark replied, Look, I know youre new but you should know this. I heard last week that Daves brother-in-law is a new part owner of Micron. I was wondering how soon it would be before he started steering business to that company. He is not the straightest character. Sharon was shocked. After a few moments, she announced that her original choice was still the best selection. At that point Mark reminded Sharon that she was replacing a terminated buyer who did not go along with one of Daves previous preferred suppliers. What does the Institute of Supply Management code of ethics say about financial conflicts of interest?
- QUESTION 1The table below shows the sales figures for a brand of shoe over the last 12 months.Months SalesJanuary 69February 75March 86April 92May 95June 100July 108August 115September 125October 131November 140December 150 a. Using the following, forecast the sales for the months up to January the following year:-i. A simple three month moving averageQUESTION ONE (b) The forecast of a product for the first week of January was 200 units, whereas the actual demand turned out to be 220 units. i. Find the forecast for the week of January assuming the smoothing constant 0.2 α = ii. Find the forecast for the third week of third week of January if the actual demand of the second week is 210 unitsQuestion 1: Kimji Company is engaged in the business of export of garments. In the past, the performance of the company had been up to the expectations. In line with the latest technology, the company decided to upgrade its machinery. For this, the Finance Manager, Abdullah estimated the amount of funds required and the timings. This will help the company in linking the investment and the financing decisions on a continuous basis. Abdullah therefore, began with the preparation of a sales forecast for the next four years. He collected the relevant data about the profit estimates in the coming years. By doing this, he wanted to be sure about the availability of funds from the internal sources of the business. For the remaining funds he is trying to find out alternative sources from outside like loan from bank etc Answer the following question based on the case study in 500-1000 words. a. What is the role of Financial Management and what are the financial decisions Involved in the above…
- QUESTION 1 Sales of Fat Lips Burgers for 2012 are shown in the table below. 1. Do the 2 month SMA forecast 2. Do 2 month WMA forecast using the information below WMA – 2: last month, 1 – last 2 months 3. For the month of January 2012, the forecast was 438. Do the EMA forecast with the smoothing constant = 0.3. What is the forecast for Jan 2013? 4. Compare the forecasts above using MAD, MSE and MAPE. Which forecast method gives the least errors? Month Actual Sales Forecast Jan 2012 438 Feb 420 March 414 Apr 318 May 306 June 240 July 240 Aug 216 Sep 198 Oct 225 Nov 270 Dec 315 Jan 2013 - QUESTION 2Dayang sells 5 kg bags of fertilizer to local farmers in Tg Karang. The sales data for the past 11 months is shown below. Month Demand (10s of bags) 1 4 2 6 3 4 4 5 5 10 6 8 7 7 8 9 9 12 10 14 11 15 1. Find the forecast for the month 12 using the methods below: a. Simple 4 month moving average (SMA) b.…QUESTION 1The table below shows the sales figures for a brand of shoe over the last 12 months. Months SalesJanuary 69February 75March 86April 92May 95June 100July 108August 115September 125October 131November 140December 150 a. Using the following, forecast the sales for the months up to January the following year:- ii. A three period weighted moving average using weights of 1, 2 and 3. Assign thehighest weight to the most recent data.Question (4): Answer the following problem: Cover Me, Inc. sells umbrellas in two cities. Management assumes that annual rainfall is the primary determinant of umbrella sales, and it wants to generate a linear regression equation to estimate potential sales in another city. Use the table below to develop a linear regression equation to find out what sales might be if the rainfall is 12 inches in City C. Show your work in the below table Rainfall X Sales Y X2 XY City A 36 inches 200 City B 30 inches 250 City C 12 inches Total 66 450
- Question 4An investor is to purchase one of three types of real estate, as illustrated in Figure below. Theinvestor must decide among an apartment building, an office building, and a warehouse. Thefuture states of nature that will determine how much profit the investor will make are goodeconomic conditions and poor economic conditions. The profits that will result from eachdecision in the event of each state of nature are shown in Table below: a) Find the optimal act using Maxi-Max criteriab) Find the optimal act using Mini-Max criteria c) Find the optimal act using Maxi-Min criteria d) Find the optimal act using Min-Max regret tableQUESTION ONE (a) The actual demand of a product for six months are summarized in the table below: Month ( ) t Demand t D 1 2 3 4 5 6 80 90 70 100 70 90 i. Find three months weighted moving averages by assuming the weights, 1 0.1 W = , 2 0.4W = and 3 0.5 W =Operations Management CH 3 Question 14 Harlen Industries has a simple forecasting model: Take the actual demand for the same month last year and divide that by the number of fractional weeks in that month. This gives the average weekly demand for that month. This weekly average is used as the weekly forecast for the same month this year. This technique was used to forecast eight weeks for this year, which are shown in the following tables along with the actual demand that occurred. The following eight weeks show the forecast (based on last year) and the demand that actually occurred: WEEK FORECAST DEMAND ACTUAL DEMAND 1 135 132 2 135 128 3 135 150 4 134 160 5 134 180 6 144 170 7 155 185 8 156 205