QUESTION 1 Which of the following best describes the trend of the graph? Scatterplot of Acreage vs Area 3 Acreage 2 0 500 1000 *Di 1500 2000 2500 3000 Area (in square feet) O There is a positive linear trend. O There is a negative linear trend. O There is no linear trend. QUESTION 2 Which of the following best describes the trend of th 3500
QUESTION 1 Which of the following best describes the trend of the graph? Scatterplot of Acreage vs Area 3 Acreage 2 0 500 1000 *Di 1500 2000 2500 3000 Area (in square feet) O There is a positive linear trend. O There is a negative linear trend. O There is no linear trend. QUESTION 2 Which of the following best describes the trend of th 3500

Glencoe Algebra 1, Student Edition, 9780079039897, 0079039898, 2018
18th Edition
ISBN:9780079039897
Author:Carter
Publisher:Carter
Chapter1: Expressions And Functions
Section1.8: Interpreting Graphs Of Functions
Problem 11PPS

Related questions
Question
Transcribed Image Text:Fials Fall22
st day
MATD 0485
t
MATD 0485
t
MATD 0485
t
MATD 0485
t
e
bmission
ng
ation
ype here to search
Instructions
Multiple Attempts Not allowed. This test can only be taken once.
Force Completion This test can be saved and resumed later.
Your answers are saved automatically.
* Question Completion Status:
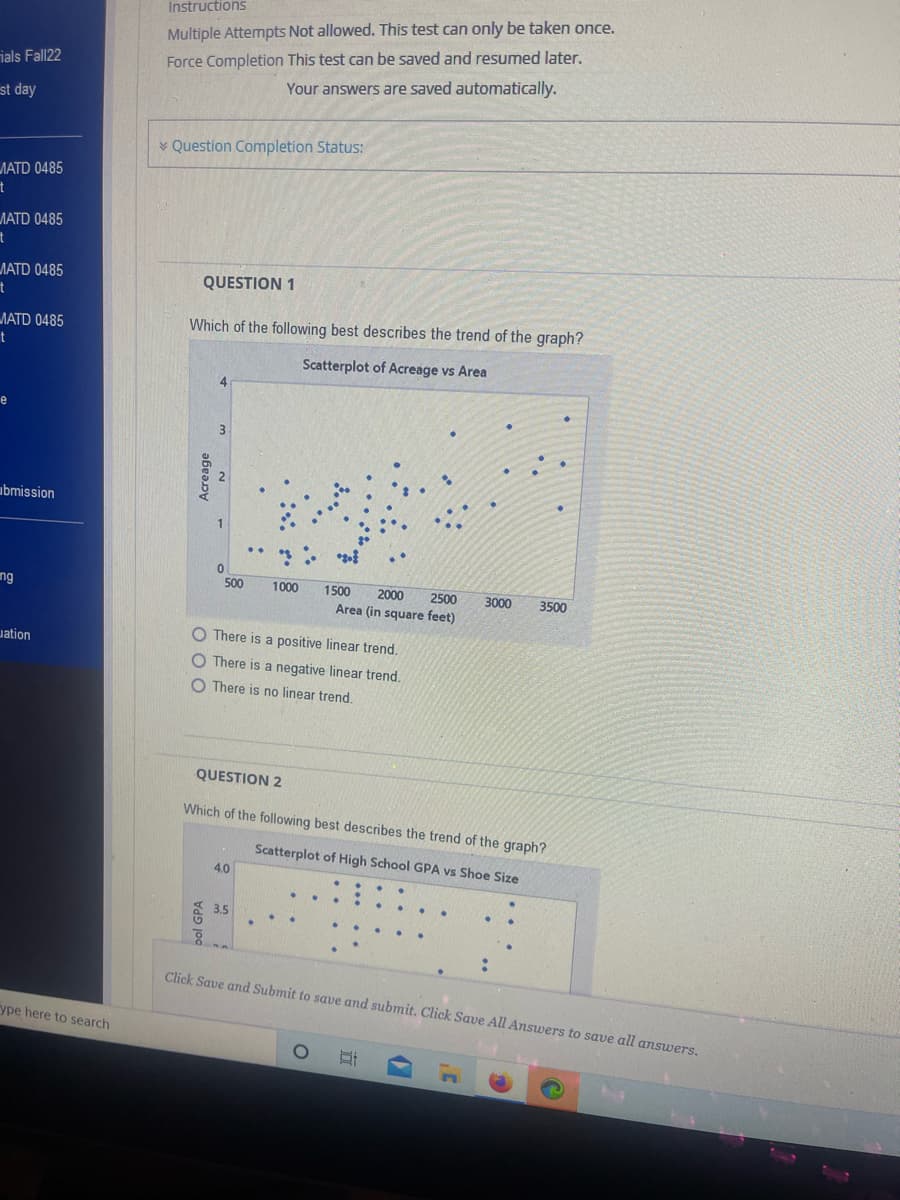
QUESTION 1
Which of the following best describes the trend of the graph?
Scatterplot of Acreage vs Area
0
500
1000
O There is a positive linear trend.
O There is a negative linear trend.
O There is no linear trend.
QUESTION 2
4.0
1500 2000 2500 3000
Area (in square feet)
3.5
Which of the following best describes the trend of the graph?
Scatterplot of High School GPA vs Shoe Size
3500
Click Save and Submit to save and submit. Click Save All Answers to save all answers.
O Ei
Expert Solution
This question has been solved!
Explore an expertly crafted, step-by-step solution for a thorough understanding of key concepts.

Step by step
Solved in 2 steps

Recommended textbooks for you
Glencoe Algebra 1, Student Edition, 9780079039897…
Algebra
ISBN:
9780079039897
Author:
Carter
Publisher:
McGraw Hill

Algebra: Structure And Method, Book 1
Algebra
ISBN:
9780395977224
Author:
Richard G. Brown, Mary P. Dolciani, Robert H. Sorgenfrey, William L. Cole
Publisher:
McDougal Littell

Algebra & Trigonometry with Analytic Geometry
Algebra
ISBN:
9781133382119
Author:
Swokowski
Publisher:
Cengage
Glencoe Algebra 1, Student Edition, 9780079039897…
Algebra
ISBN:
9780079039897
Author:
Carter
Publisher:
McGraw Hill
Algebra: Structure And Method, Book 1
Algebra
ISBN:
9780395977224
Author:
Richard G. Brown, Mary P. Dolciani, Robert H. Sorgenfrey, William L. Cole
Publisher:
McDougal Littell
Algebra & Trigonometry with Analytic Geometry
Algebra
ISBN:
9781133382119
Author:
Swokowski
Publisher:
Cengage