QUESTION 2 The following table tabulates the relation between diameter of sedimentation tank with the height of the tank. Tank Height (m) 35 Tank Diameter (m) 8 49 9 27 33 60 13 21 7 45 51 11 12 i. Construct a scatter plot between the tank height and tank diameter. ii. Compute the value of the correlation coefficient between variables. iii. What is the linear relationship between the variables?
QUESTION 2 The following table tabulates the relation between diameter of sedimentation tank with the height of the tank. Tank Height (m) 35 Tank Diameter (m) 8 49 9 27 33 60 13 21 7 45 51 11 12 i. Construct a scatter plot between the tank height and tank diameter. ii. Compute the value of the correlation coefficient between variables. iii. What is the linear relationship between the variables?

Solid Waste Engineering
3rd Edition
ISBN:9781305635203
Author:Worrell, William A.
Publisher:Worrell, William A.
Chapter5: Separation Processes
Section: Chapter Questions
Problem 5.6P

Related questions
Question
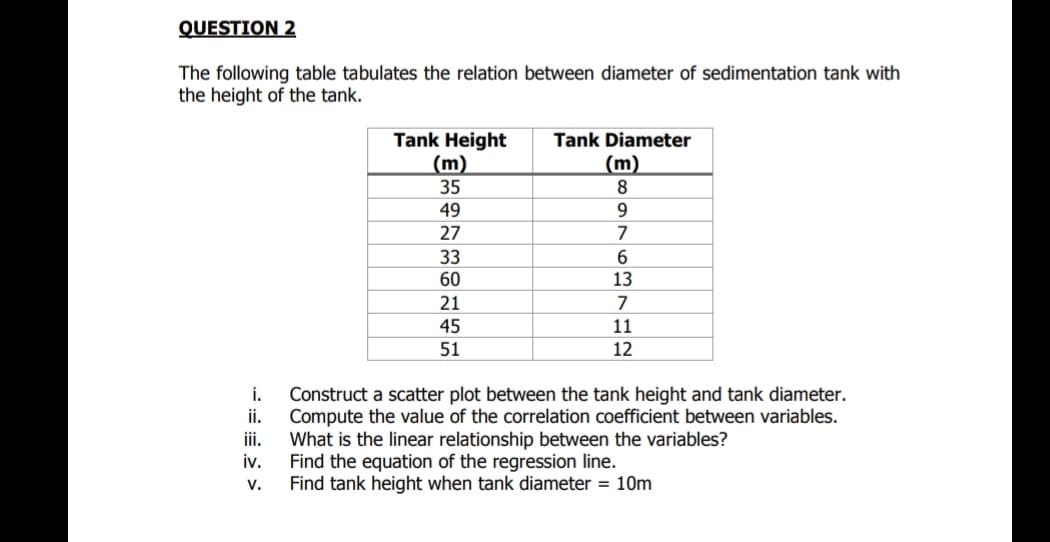
Transcribed Image Text:QUESTION 2
The following table tabulates the relation between diameter of sedimentation tank with
the height of the tank.
Tank Height
(m)
35
Tank Diameter
(m)
8.
49
9
27
33
60
13
21
45
11
51
12
Construct a scatter plot between the tank height and tank diameter.
ii.
i.
Compute the value of the correlation coefficient between variables.
What is the linear relationship between the variables?
iv.
ii.
Find the equa
Find tank height when tank diameter = 10m
of the regression line.
V.
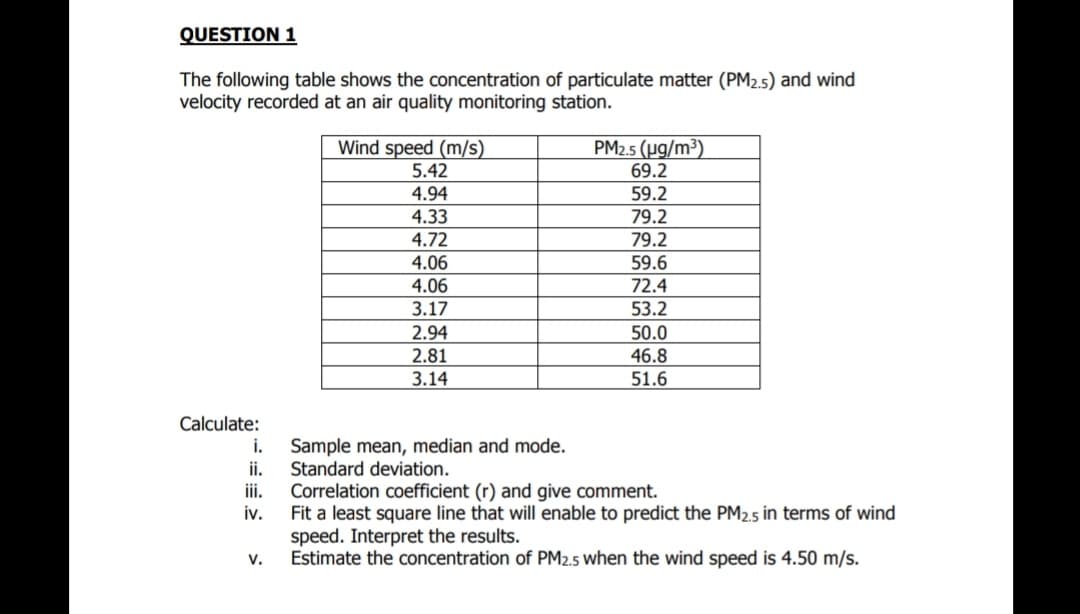
Transcribed Image Text:QUESTION 1
The following table shows the concentration of particulate matter (PM2.5) and wind
velocity recorded at an air quality monitoring station.
Wind speed (m/s)
PM2.5 (ug/m³)
69.2
5.42
4.94
59.2
4.33
79.2
4.72
79.2
4.06
59.6
4.06
72.4
3.17
53.2
2.94
50.0
2.81
46.8
3.14
51.6
Calculate:
i.
Sample mean, median and mode.
ii.
Standard deviation.
Correlation coefficient (r) and give comment.
Fit a least square line that will enable to predict the PM2.5 in terms of wind
speed. Interpret the results.
Estimate the concentration of PM2.5 when the wind speed is 4.50 m/s.
ii.
iv.
V.
Expert Solution
This question has been solved!
Explore an expertly crafted, step-by-step solution for a thorough understanding of key concepts.

Step by step
Solved in 2 steps with 1 images

Recommended textbooks for you
Solid Waste Engineering
Civil Engineering
ISBN:
9781305635203
Author:
Worrell, William A.
Publisher:
Cengage Learning,
Solid Waste Engineering
Civil Engineering
ISBN:
9781305635203
Author:
Worrell, William A.
Publisher:
Cengage Learning,