Question 3. Based on your answers from questions 1 and 2, calculate the upper and lower control limits for mean and range charts, and decide if the process is in control Upper control limit Lower control limit In control? Upper control limit Lower control limit In control? Mean Chart Range Chart
Question 3. Based on your answers from questions 1 and 2, calculate the upper and lower control limits for mean and range charts, and decide if the process is in control Upper control limit Lower control limit In control? Upper control limit Lower control limit In control? Mean Chart Range Chart

Practical Management Science
6th Edition
ISBN:9781337406659
Author:WINSTON, Wayne L.
Publisher:WINSTON, Wayne L.
Chapter2: Introduction To Spreadsheet Modeling
Section: Chapter Questions
Problem 20P: Julie James is opening a lemonade stand. She believes the fixed cost per week of running the stand...

Related questions
Question
Kindly answer question 3
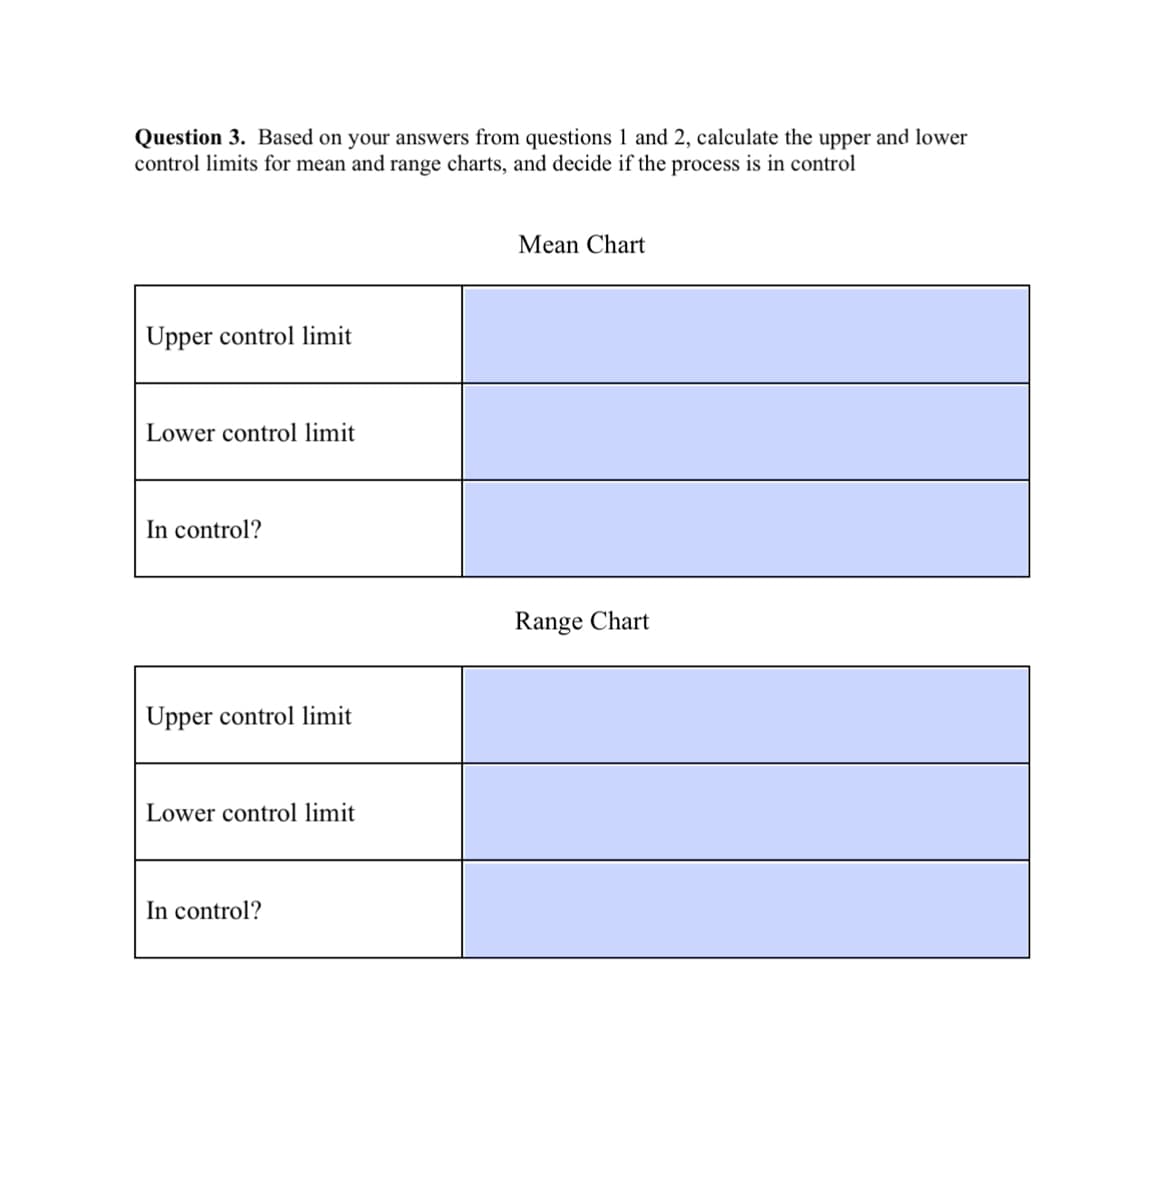
Transcribed Image Text:Question 3. Based on your answers from questions 1 and 2, calculate the upper and lower
control limits for mean and range charts, and decide if the process is in control
Upper control limit
Lower control limit
In control?
Upper control limit
Lower control limit
In control?
Mean Chart
Range Chart
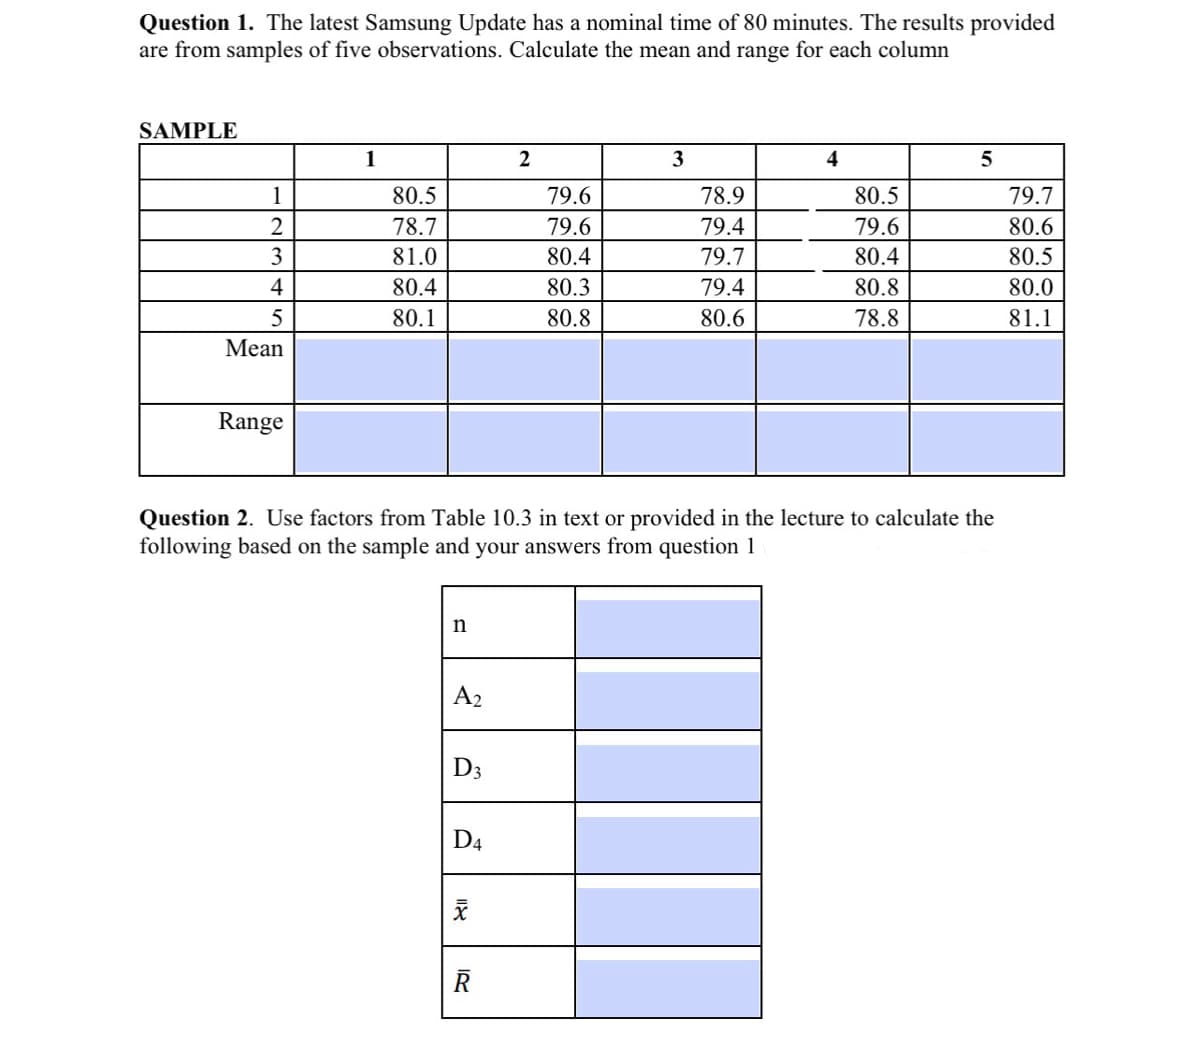
Transcribed Image Text:Question 1. The latest Samsung Update has a nominal time of 80 minutes. The results provided
are from samples of five observations. Calculate the mean and range for each column
SAMPLE
1
2
3
4
5
Mean
Range
1
80.5
78.7
81.0
80.4
80.1
n
A2
D3
D4
און
2
R
79.6
79.6
80.4
80.3
80.8
Question 2. Use factors from Table 10.3 in text or provided in the lecture to calculate the
following based on the sample and your answers from question 1
3
78.9
79.4
79.7
79.4
80.6
4
80.5
79.6
80.4
80.8
78.8
5
79.7
80.6
80.5
80.0
81.1
Expert Solution
This question has been solved!
Explore an expertly crafted, step-by-step solution for a thorough understanding of key concepts.

This is a popular solution!

Trending now
This is a popular solution!

Step by step
Solved in 3 steps with 7 images

Recommended textbooks for you
Practical Management Science
Operations Management
ISBN:
9781337406659
Author:
WINSTON, Wayne L.
Publisher:
Cengage,

Operations Management
Operations Management
ISBN:
9781259667473
Author:
William J Stevenson
Publisher:
McGraw-Hill Education

Operations and Supply Chain Management (Mcgraw-hi…
Operations Management
ISBN:
9781259666100
Author:
F. Robert Jacobs, Richard B Chase
Publisher:
McGraw-Hill Education
Practical Management Science
Operations Management
ISBN:
9781337406659
Author:
WINSTON, Wayne L.
Publisher:
Cengage,
Operations Management
Operations Management
ISBN:
9781259667473
Author:
William J Stevenson
Publisher:
McGraw-Hill Education
Operations and Supply Chain Management (Mcgraw-hi…
Operations Management
ISBN:
9781259666100
Author:
F. Robert Jacobs, Richard B Chase
Publisher:
McGraw-Hill Education


Purchasing and Supply Chain Management
Operations Management
ISBN:
9781285869681
Author:
Robert M. Monczka, Robert B. Handfield, Larry C. Giunipero, James L. Patterson
Publisher:
Cengage Learning

Production and Operations Analysis, Seventh Editi…
Operations Management
ISBN:
9781478623069
Author:
Steven Nahmias, Tava Lennon Olsen
Publisher:
Waveland Press, Inc.