Question 5 Let P(t) be a deer population (in thousands) of an ecological region t years after 2000. A graph of the derivative P'(t) is give below. Use it to answer the following questions. P 4 2 4 6 8 10 12 14 -2 (a) Estimate P'(8) and write a sentence interpreting its value in terms of the deer population. (b) Indicate the years during which the deer population declined. (c) Order the following from least to greatest. If there is a tie, indicate that with an equals sign. You do not need to find the values themselves: P'(1), P'(3), P'(6), P'(7), P'(9), P'(10). (d) Order the following from least to greatest. If there is a tie, indicate that with an equals sign. You do not need to find the values themselves: P(0), P(2), P(3), P(5), P(7), P(9). (e) Order the following from least to greatest. If there is a tie, indicate that with an equals sign. You do not need to find the values themselves: P(9), P(11), P(14), P(15). P (2+ h) — Р'(2) (f) Evaluate the limit lim h→0 to
Question 5 Let P(t) be a deer population (in thousands) of an ecological region t years after 2000. A graph of the derivative P'(t) is give below. Use it to answer the following questions. P 4 2 4 6 8 10 12 14 -2 (a) Estimate P'(8) and write a sentence interpreting its value in terms of the deer population. (b) Indicate the years during which the deer population declined. (c) Order the following from least to greatest. If there is a tie, indicate that with an equals sign. You do not need to find the values themselves: P'(1), P'(3), P'(6), P'(7), P'(9), P'(10). (d) Order the following from least to greatest. If there is a tie, indicate that with an equals sign. You do not need to find the values themselves: P(0), P(2), P(3), P(5), P(7), P(9). (e) Order the following from least to greatest. If there is a tie, indicate that with an equals sign. You do not need to find the values themselves: P(9), P(11), P(14), P(15). P (2+ h) — Р'(2) (f) Evaluate the limit lim h→0 to

Chapter6: Exponential And Logarithmic Functions
Section6.8: Fitting Exponential Models To Data
Problem 3TI: Table 6 shows the population, in thousands, of harbor seals in the Wadden Sea over the years 1997 to...

Related questions
Question
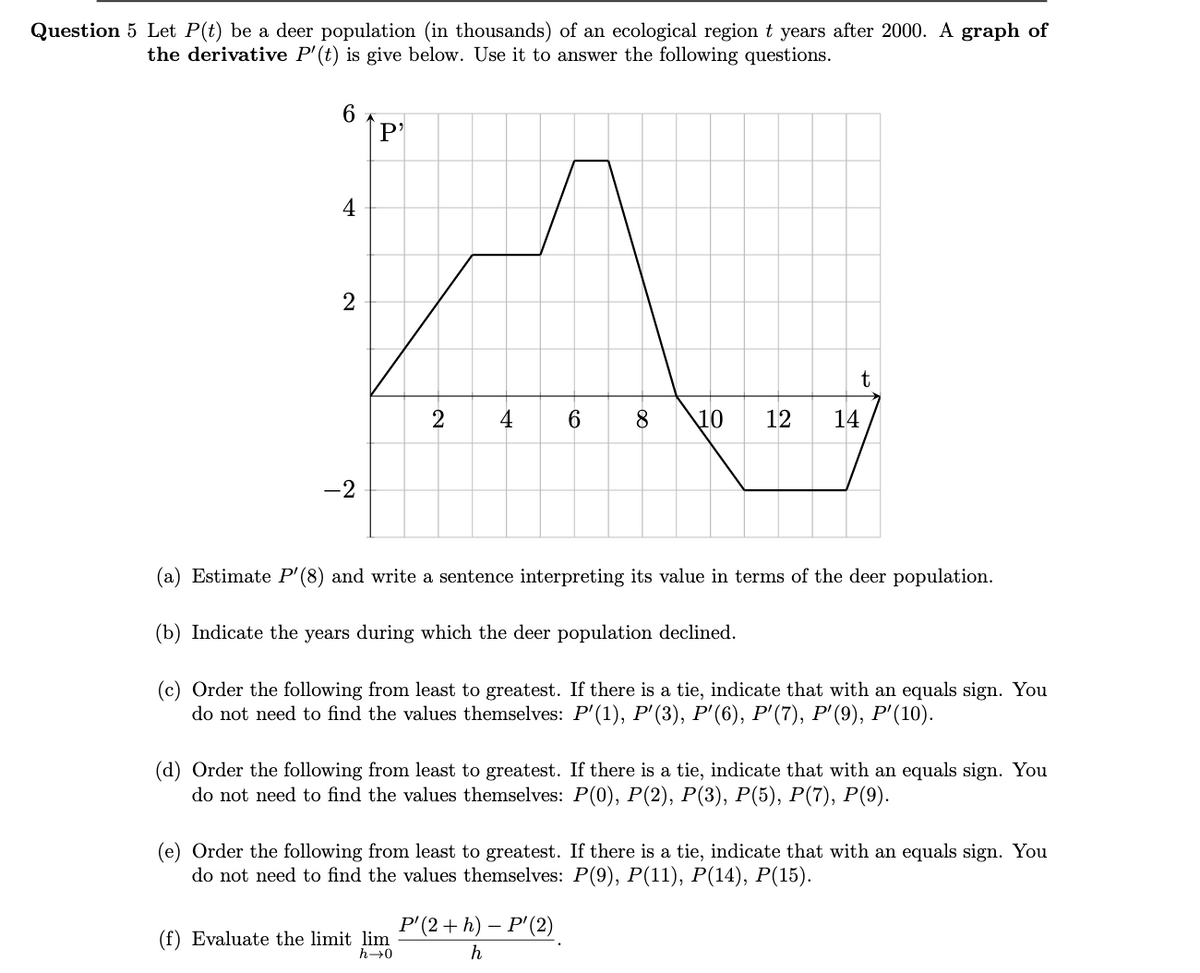
Transcribed Image Text:Question 5 Let P(t) be a deer population (in thousands) of an ecological region t years after 2000. A graph of
the derivative P'(t) is give below. Use it to answer the following questions.
6.
[P'
4
2
2
4
6.
8.
\10
12
14
-2
(a) Estimate P'(8) and write a sentence interpreting its value in terms of the deer population.
(b) Indicate the years during which the deer population declined.
(c) Order the following from least to greatest. If there is a tie, indicate that with an equals sign. You
do not need to find the values themselves: P'(1), P'(3), P'(6), P'(7), P'(9), P'(10).
(d) Order the following from least to greatest. If there is a tie, indicate that with an equals sign. You
do not need to find the values themselves: P(0), P(2), P(3), P(5), P(7), P(9).
(e) Order the following from least to greatest. If there is a tie, indicate that with an equals sign. You
do not need to find the values themselves: P(9), P(11), P(14), P(15).
P(2+ h) — Р'(2)
(f) Evaluate the limit lim
h→0
h
Expert Solution
This question has been solved!
Explore an expertly crafted, step-by-step solution for a thorough understanding of key concepts.

This is a popular solution!

Trending now
This is a popular solution!

Step by step
Solved in 3 steps with 1 images

Recommended textbooks for you

Linear Algebra: A Modern Introduction
Algebra
ISBN:
9781285463247
Author:
David Poole
Publisher:
Cengage Learning

Functions and Change: A Modeling Approach to Coll…
Algebra
ISBN:
9781337111348
Author:
Bruce Crauder, Benny Evans, Alan Noell
Publisher:
Cengage Learning
Linear Algebra: A Modern Introduction
Algebra
ISBN:
9781285463247
Author:
David Poole
Publisher:
Cengage Learning
Functions and Change: A Modeling Approach to Coll…
Algebra
ISBN:
9781337111348
Author:
Bruce Crauder, Benny Evans, Alan Noell
Publisher:
Cengage Learning