Question 6 The variable yearly income is examined in a regression setting where the predictor variable is lag (1) of income and the following output is produced. us_change %>8 model (TSLM (log (Income) log (LagIncome))) %>% report() #> Series: Consumption #> Model: TSLM #> #> Residuals: #> Min 10 Median 30 #> -2.5824 -0.2778 0.0186 0.3233 <# #> #> Coefficients: Max 1.4223 Estimate Std. Error t value Pr (>|t|) 0.0540 10.08 < 2e-16 *** 0.0467 0.582 0.242 #> (Intercept) 0.5445 #> Log (LagIncome) 0.1000 #> --- #> Signif. codes: 0 ***** 0.001*** 0.01 * 0.05. 0.1 #> #> Residual standard error: 0.591 on 196 degrees of freedom #> Multiple R-squared: 0.0847, Adjusted R-squared: 0.0843 1 a) Write down the regression equation. b) Interpret the meaning of the slope. c) Explain whether this model is appropriate to use for forecasting based on this output.
Question 6 The variable yearly income is examined in a regression setting where the predictor variable is lag (1) of income and the following output is produced. us_change %>8 model (TSLM (log (Income) log (LagIncome))) %>% report() #> Series: Consumption #> Model: TSLM #> #> Residuals: #> Min 10 Median 30 #> -2.5824 -0.2778 0.0186 0.3233 <# #> #> Coefficients: Max 1.4223 Estimate Std. Error t value Pr (>|t|) 0.0540 10.08 < 2e-16 *** 0.0467 0.582 0.242 #> (Intercept) 0.5445 #> Log (LagIncome) 0.1000 #> --- #> Signif. codes: 0 ***** 0.001*** 0.01 * 0.05. 0.1 #> #> Residual standard error: 0.591 on 196 degrees of freedom #> Multiple R-squared: 0.0847, Adjusted R-squared: 0.0843 1 a) Write down the regression equation. b) Interpret the meaning of the slope. c) Explain whether this model is appropriate to use for forecasting based on this output.

Trigonometry (MindTap Course List)
8th Edition
ISBN:9781305652224
Author:Charles P. McKeague, Mark D. Turner
Publisher:Charles P. McKeague, Mark D. Turner
Chapter4: Graphing And Inverse Functions
Section: Chapter Questions
Problem 6GP: If your graphing calculator is capable of computing a least-squares sinusoidal regression model, use...

Related questions
Question
Transcribed Image Text:Question 6
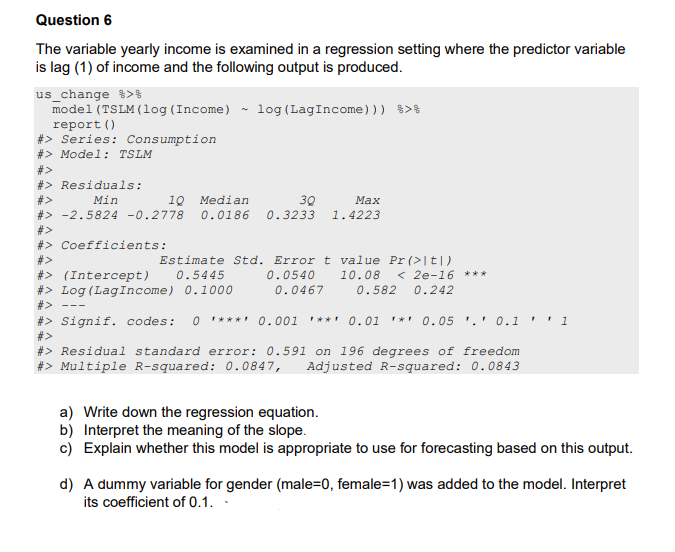
The variable yearly income is examined in a regression setting where the predictor variable
is lag (1) of income and the following output is produced.
us_change %>%
model (TSLM (log (Income) ~ log (LagIncome))) %>%
report ()
#> Series: Consumption
#> Model: TSLM
#>
#> Residuals:
Min
10 Median
30
#> -2.5824 -0.2778 0.0186 0.3233
#>
#> Coefficients:
Max
1.4223
#>
#> (Intercept) 0.5445
#> Log (LagIncome) 0.1000
#>
Estimate Std. Error t value Pr (>|t|)
0.0540 10.08 < 2e-16 ***
0.0467 0.582 0.242
#> Signif. codes: 0 ***** 0.001 **** 0.01 * 0.05. 0.1
#>
#> Residual standard error: 0.591 on 196 degrees of freedom
#> Multiple R-squared: 0.0847, Adjusted R-squared: 0.0843
1
a) Write down the regression equation.
b) Interpret the meaning of the slope.
c) Explain whether this model is appropriate to use for forecasting based on this output.
d) A dummy variable for gender (male=0, female=1) was added to the model. Interpret
its coefficient of 0.1..
Expert Solution
This question has been solved!
Explore an expertly crafted, step-by-step solution for a thorough understanding of key concepts.

Step by step
Solved in 4 steps

Recommended textbooks for you
Trigonometry (MindTap Course List)
Trigonometry
ISBN:
9781305652224
Author:
Charles P. McKeague, Mark D. Turner
Publisher:
Cengage Learning
Trigonometry (MindTap Course List)
Trigonometry
ISBN:
9781305652224
Author:
Charles P. McKeague, Mark D. Turner
Publisher:
Cengage Learning