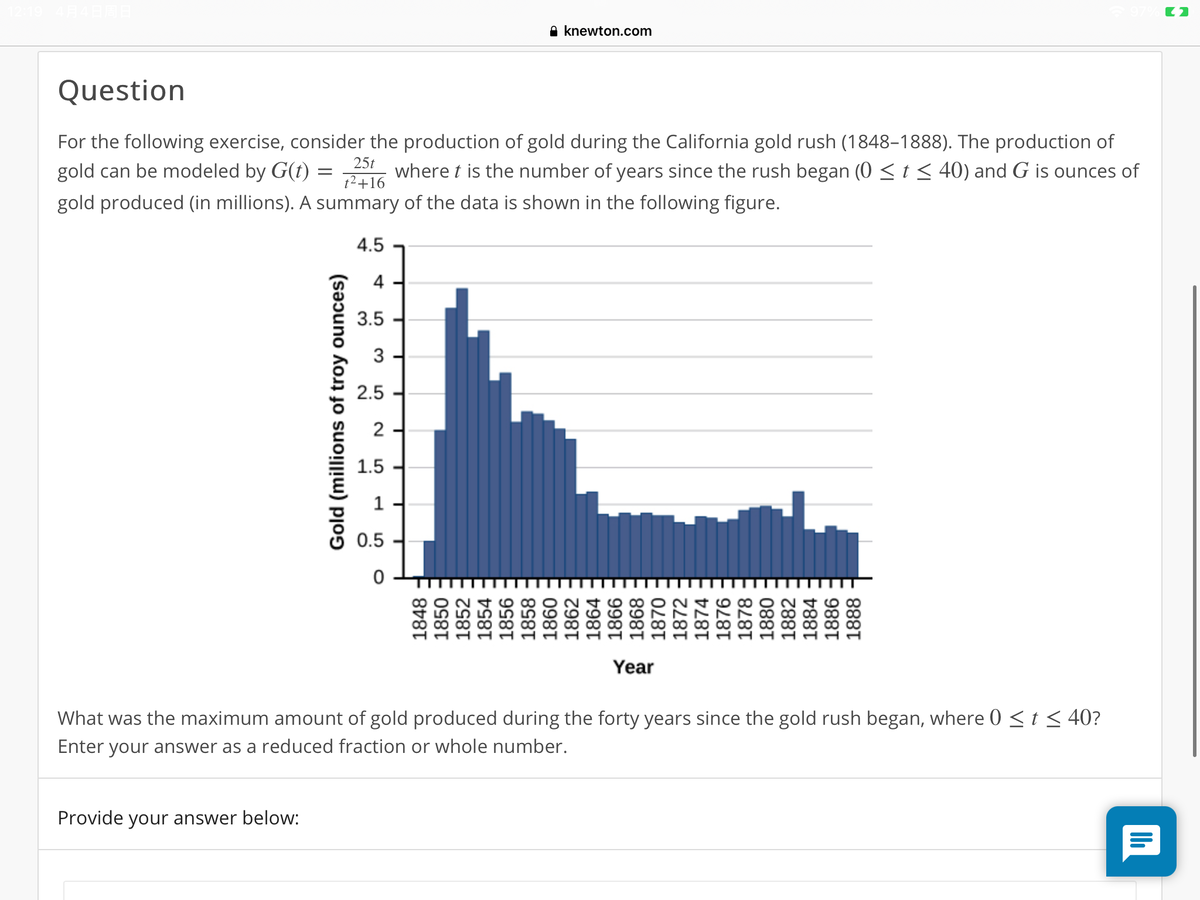
Question For the following exercise, consider the production of gold during the California gold rush (1848-1888). The production of 25t gold can be modeled by G(t) = where t is the number of years since the rush began (0 < t< 40) and G is ounces of 12+16 gold produced (in millions). A summary of the data is shown in the following figure. 4.5 4 3.5 3 2.5 2 1.5 0.5 Year What was the maximum amount of gold produced during the forty years since the gold rush began, where 0 < t < 40? Enter your answer as a reduced fraction or whole number. Provide your answer below: Gold (millions of troy ounces) 1848 ; 1850 ; 1852 1854 E 998T 1858 ; E 098T 1862 1864 : E 998 * 1868 3 F 0L8T 1872 ; 1874 1876 1878 1880 1882 1884 - 1888


Inverse Normal Distribution
The method used for finding the corresponding z-critical value in a normal distribution using the known probability is said to be an inverse normal distribution. The inverse normal distribution is a continuous probability distribution with a family of two parameters.
Mean, Median, Mode
It is a descriptive summary of a data set. It can be defined by using some of the measures. The central tendencies do not provide information regarding individual data from the dataset. However, they give a summary of the data set. The central tendency or measure of central tendency is a central or typical value for a probability distribution.
Z-Scores
A z-score is a unit of measurement used in statistics to describe the position of a raw score in terms of its distance from the mean, measured with reference to standard deviation from the mean. Z-scores are useful in statistics because they allow comparison between two scores that belong to different normal distributions.


Trending now
This is a popular solution!

Step by step
Solved in 2 steps with 2 images


