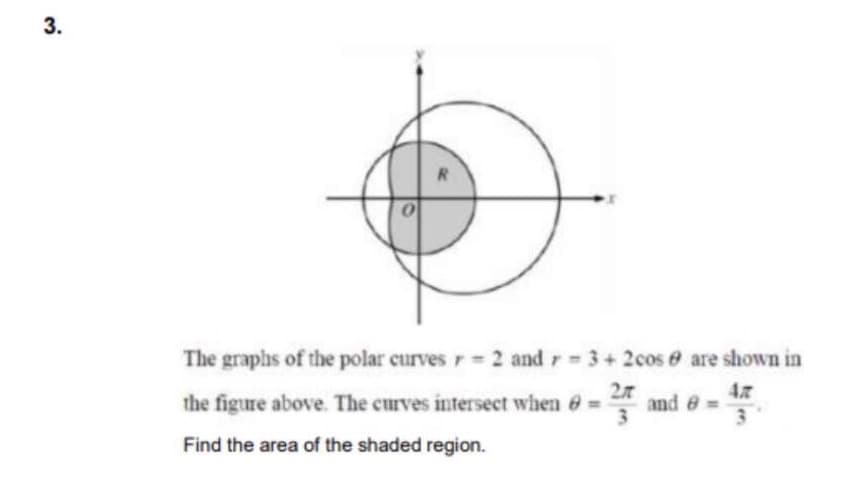
R The graphs of the polar curves r= 2 and r= 3+ 2cos e are shown in the figure above. The curves intersect when 6= and e Find the area of the shaded region.


Q: (b) and n, if mn is even, then m is even or n is even. Use an indirect proof by contrapositive to pr...
A:
Q: Fourier Transform of
A: Fourier Transform:- It is a mathematical transform which decomposes functions depending on space or ...
Q: Use Prim's algorithm to compute the minimum spanning tree for the weighted graph. Start the algorith...
A: Algorithm 1) Create a set mstSet that keeps track of vertices already included in minimum spanning t...
Q: h - 25 4. The base of a triangle is (h + 5) and the height is 2 4h + 20 2h – 10 a) What is the area ...
A:
Q: d g(t) = 2t of the two funct
A: Given as, f(t)=1+t ,g(t)=2t
Q: Evaluate z and express the final answer in polar form b. (5 - j7) (4235)- 6e-7 Z = 5(cos 30' +j sin ...
A: The given problem is to evaluate and simplify the given complex expression and express in the polar ...
Q: X + x2 - 3x, = 3 -2x, - x, =-4 4x, +2x, +3x, = 7 Solve the system using Gaussi an elimination:
A:
Q: Exercise 3.2.3 Show that Z, under addition is isomorphic to Z; under multiplication.
A:
Q: ne initial value problem d.x 3- teat ¤(0) : %3D %3D dt2 dt
A:
Q: Find the slope of the line containing the given points. P1(−1, −8), P2(−7, 4)
A:
Q: D Learning Task 1: Translate the verbal sentence to mathematical sentence. Use variable x to represe...
A:
Q: 2(s - 4) [s² +2s+10] What is L using Completing the Square? 2e cos 3t 4 -e sin3t 3 В. 2е сos3t C. -2...
A: To solve given inverse Laplace transform first we write it in the standard form and then use the for...
Q: What makes math difficult for students?
A: Mathematics would be easy if the student know what to do. If a student cannot determine what to do t...
Q: S5x sec?x dx 5.
A:
Q: dy for e dx (*² +1), 6. Determine ln( 19) + x² – xy =
A:
Q: 5. Assume that an ant moves on a plane continuously; that is, its coordinates x(t) and y(t) are cont...
A: (a) equation of unit circle can be written as - at (0.7,0.1) at (-2,3) we see the change in sign ...
Q: 2. Let u e R" and v e R" be two non-zero vectors, in other words at least one component of the vecto...
A:
Q: 1 at is L ? 2 s+4 S
A:
Q: Hillary T T. F Bernie F T. Donald F T F Jeb F T T. Carly F T. F 3x (M(x) A D(x)
A: ∃xMx∧Dx according to given expression for the entire statement to be true for some values of x both...
Q: Consider the following Linear Program: (1 1 1 1 1 1 1) x 1 1 0 2 1 0 2 2 0 0 -2 1 1215 4 max 1 1 sub...
A: Since you have asked multiple question, we will solve the first question for you. If you want any sp...
Q: B. Yes because the diagonals are not congruent C. No because the legs are not congruent D. No becaus...
A: according to our guidelines we can answer only three subparts, or first question and rest can be rep...
Q: Evaluate the given integral where C is the left half of the unit circle in ccd.
A: Note:- In given problem you mention "ccd" but one short form has different different full form. So, ...
Q: Given the relative condition number of a root x = r of ax? + bx + c=0 due to perturbations in a: K =...
A: The complete solutions are given below
Q: ) Sx³sinx dx .3
A:
Q: ( 3a - 2) = (3a)3-3(3a)2(2) + 3(3a)(2)2 - (2)3 = 27a3 - 54a2 + 36a- 8 D CLMD Learning Task 1: Find t...
A: Disclaimer: Since you have asked multiple questions, we will solve the first question for you. If yo...
Q: find the surface area of a the cap that is cut from the sphere x 2 + y 2 + z 2 = 3 by the cone z =s...
A:
Q: 7 7. Determine the solution to the I.V.P. y"+7y'+12y=2le*,y(0)=y'(0)=-10
A: Note: According to Company Guidelines we are providing the answer of first question. Kindly post oth...
Q: 2. Let u e R™ and v E R be two non-zero vectors, in other words at least one component of the vector...
A: Given: Let us consider the u∈ℝm and v∈Rn are two non-zero vectors and assume A=uvT∈ℝm×n. a) Presume ...
Q: Learning Task 7: Sketch one possible graph of a function f(x) defined on R that satisfies all the li...
A: Given that limx→-4fx=DNE, limx→-2fx=0, limx→-1fx=0, limx→0fx=2limx→1fx=DNE, limx→2fx=-3, limx→4fx=5...
Q: By using L(x)%3D1and L(x)= 1-x in Lagure polynomials, calculate the value of
A:
Q: Let f(z)= for 0 <I<6, for 6 <z< 7. %3D Compute the Fourier cosine coefficients for f(z). Ao %3D %3D ...
A: Fourier cosine co efficient A0=2L∫0Lf(x)dxAn=2L∫0Lf(x)cosnπxLdx
Q: 6S- 5 4s+7 2.
A:
Q: 10. Determine the length of a to the nearest whole number. 9 a 26° 18
A:
Q: Exercise 3.2.3 Show that Zg under addition is isomorphic to Z; under multiplication.
A: We know that, Z6 = {0, 1, 2, 3, 4, 5} and Z7* = {1, 2, 3, 4, 5, 6}. A group isomorphism is a functio...
Q: - vx ( P(x) A Q(x)) = 3x (-P(x) V ¬ Q(x)) True O False
A: Since you have posted a multiple question according to guildlines I will solve first question for yo...
Q: »4-x² 1-y- xe?y dy dx 4 - y (b) Ln(a² + y? + 1) d dy (a) 0, /1-y²
A:
Q: determine the parametric coordinate of the critical point of the curve x=t^2+3t=2 and y=t^2-1.
A: Curve will have critical point if it have vertical tangent or horizontal tangent . Slope of horizont...
Q: Find the general solution of this DE using INSPECTION. dnda + +(x? t y?)dx = 0 2 aycdly
A:
Q: Determine whether it is possible to express 1 as a liner combination of 1 = m· 44 + n· 91 ,. for som...
A:
Q: - ) s2 – 4 2s+6 What is L -2 cos 2t-3 sin 2t A.
A: find the inverse laplace transform of L-1-2s+6s2-4 we can write the function as -2s+6s2-4=-52s+2+12s...
Q: Spee H Spe 2 Ze XGmovie How Spe GHow M8|L4 Dot Plots This dot plot represents the ages of people who...
A: Total number of people attended the basketball game of all ages are 10.
Q: -1 Write X = as a product X = E¡E2E3 of elementary matrices. E1 = E2 = E3 =
A:
Q: 2. Find the volume of the solid that results when the shaded region is revolved about the indicated ...
A:
Q: 21. x+y -2x+4y-4=0 22. x+y +6x-4y-3= Written Math- E Transform each equation into center-radius form...
A:
Q: A movie complex is showing the same movie in three theaters. In theater A, 112 of the 160 seats are ...
A:
Q: Exercise 3.2.17 State whether each of the following statements is true or false and give a brief rea...
A:
Q: (5) Use the expansions (Maclaurin series) 1 (1) Ew", w| < 1 1- w n=0 1 (2) E(-1)"w", w|<1 1+ w n=0 t...
A:
Q: Solve for the 2nd order nonhomogeneous linear equation: y"+12y'+37y=10e-4t ; y(0)=4, y'(0)=0
A:
Q: Show that 19nni se enoion gaiwollo tolo nsis oirlyan b-a b- |
A:
Q: Find the determinant of the given matrix: For part (a): 3 -2 [A] = 0 -3 4 4 -
A:


Trending now
This is a popular solution!

Step by step
Solved in 2 steps with 2 images

- Find the exact length of the polar curve r=e2(theta) , where 0 is less than or equal too theta is less than or equal too ln(3).The graphs of the polar curves r=5 and r=5+2sin(3ø) are shown in the figure for 0 is less than or equal to ø is less than or equal to 2 pi. A particle is moving along the curve r=5+2sin (3ø) so that dø/dt=5 for all times t is greater than or equal to 0 find the value of dr/dt at ø =pi/96. Consider the curves: r = 2 + cos 2θ and r = 2 + sin 2θ, a) Sketch a graph of both curves on the polar graph provided. b) Find all points of intersection. c) Find the total area inside r = 2 + cos (2θ) and outside r = 2 + sin (2θ)
- 2. Consider the polar curves r = 4 - 2cosθ and r = 2 + 2cosθ. In this problem, we want to find the area of A, B, and C pictured below. (c) B is the area inside both r = 2 + 2cosθ and r = 4 - 2cosθ. Find the area of B. (Hint: What happens at the angle where the two polar curves intersect? Your answer should involve a sum of two polar integrals.)2. Consider the polar curves r = 4 - 2cosθ and r = 2 + 2cosθ. In this problem, we want to find the area of A, B, and C pictured below. (d) C is the area inside r = 4 - 2cosθ but outside r = 2 + 2cosθ. Find the area of C. (Hint: The inner and outer polar curves switch for C in comparison to A.)The graphs of the polar curves r=5 and r=5+2sin(3ø) are shown in the figure for 0 is less than or equal to ø is less than or equal to 2 pi. Write the expressions for dx/dø and dy/dø for the curve r=5+2sin(3ø).
- 4. Find the exact length of the polar curve r = e2θ, 0 ≤ θ ≤ 2π.Given the graphs of polar equations: r=1 and r=−2cosθ, (a) Set up the integral that gives the area of the shaded region. (b) Evaluate the area of the region showing all your steps.6. Consider the curves: r = 2 + cos2? and r = 2 + sin2?a) Sketch a graph of both curves on the polar graph provided.b) Find all points of intersection.c) Find the total area inside r = 2 + cos (2?) and outside r = 2 + sin (2?)
- Graph (either by hand or desmos) the polar curves r = 3 andr = 3 + 3 cos θ. Use a double integral to find the area inside thecircle, but outside of the cardioid.The graphs of the polar curves r=5 and r=5+2sin(3ø) are shown in the figure for 0 is less than or equal to ø is less than or equal to 2 pi. Let R be the area of the shaded region inside the graph of r=5 and inside the graph of r=5+2sin(3ø) from 0 is less than or equal to ø is less than or equal to pi. Write an integral expression for the area of R.Consider polar curves C1 : r = −3 sin(2θ) and C2 : r = 3 sin θ.Set up the definite integral for the perimeter and area of the region outside C1 but inside C2. See graph below