rate of oxygen production- This graph shows a. b. d. e. 350 400 450 500 550 600 wavelength (nm) an action spectrum. an absorbance spectrum. a production spectrum. a transmission spectrum. a passing spectrum. 650 700
rate of oxygen production- This graph shows a. b. d. e. 350 400 450 500 550 600 wavelength (nm) an action spectrum. an absorbance spectrum. a production spectrum. a transmission spectrum. a passing spectrum. 650 700

Biology: The Dynamic Science (MindTap Course List)
4th Edition
ISBN:9781305389892
Author:Peter J. Russell, Paul E. Hertz, Beverly McMillan
Publisher:Peter J. Russell, Paul E. Hertz, Beverly McMillan
Chapter8: Photosynthesis
Section: Chapter Questions
Problem 15TYK

Related questions

Question
Transcribed Image Text:rate of oxygen production-
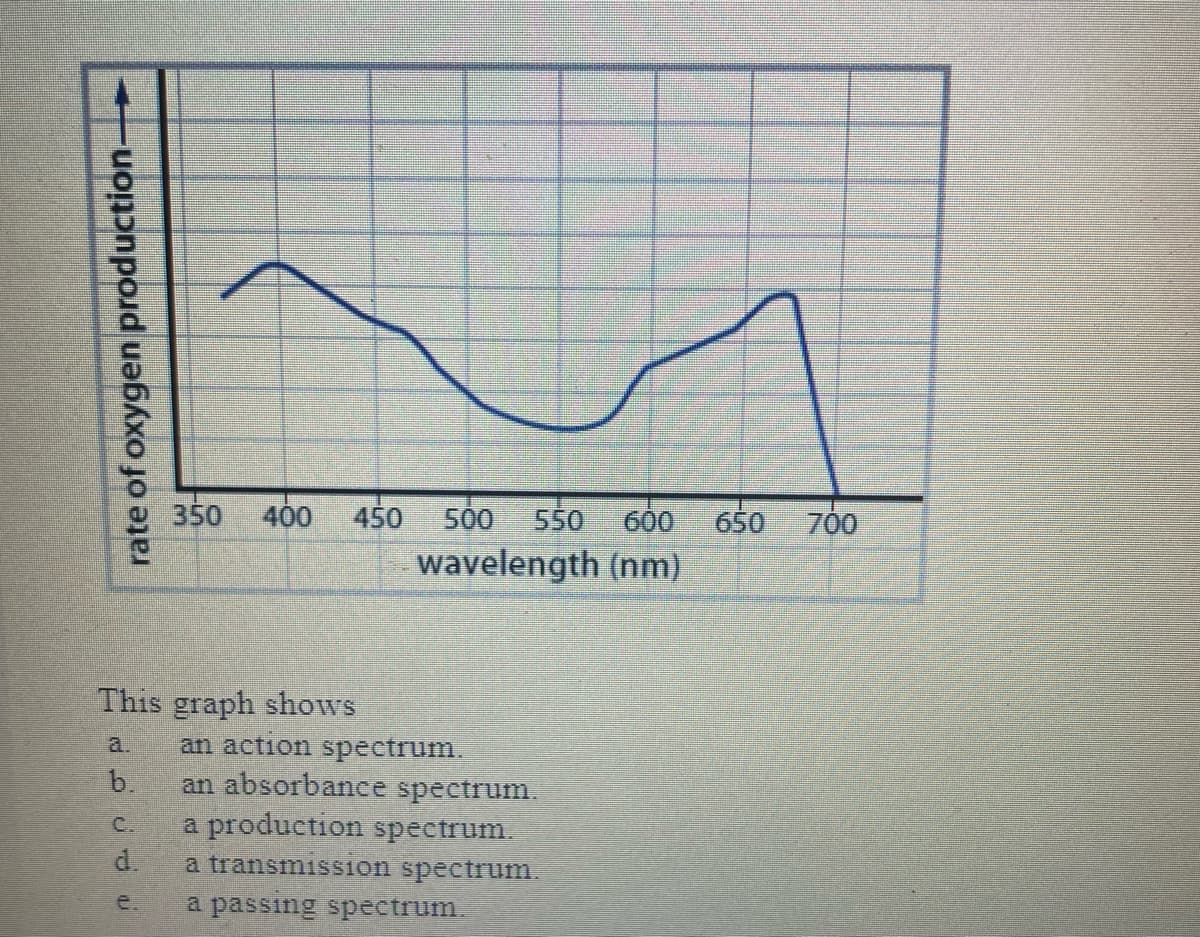
This graph shows
C
350 400 450 500
550 600 650 700
wavelength (nm)
an action spectrum.
b. an absorbance spectrum.
a production spectrum.
a transmission spectrum.
a passing spectrum.
d.
Expert Solution
This question has been solved!
Explore an expertly crafted, step-by-step solution for a thorough understanding of key concepts.

Step by step
Solved in 2 steps

Knowledge Booster


Learn more about
Need a deep-dive on the concept behind this application? Look no further. Learn more about this topic, biology and related others by exploring similar questions and additional content below.Recommended textbooks for you
Biology: The Dynamic Science (MindTap Course List)
Biology
ISBN:
9781305389892
Author:
Peter J. Russell, Paul E. Hertz, Beverly McMillan
Publisher:
Cengage Learning


Biology: The Dynamic Science (MindTap Course List)
Biology
ISBN:
9781305389892
Author:
Peter J. Russell, Paul E. Hertz, Beverly McMillan
Publisher:
Cengage Learning