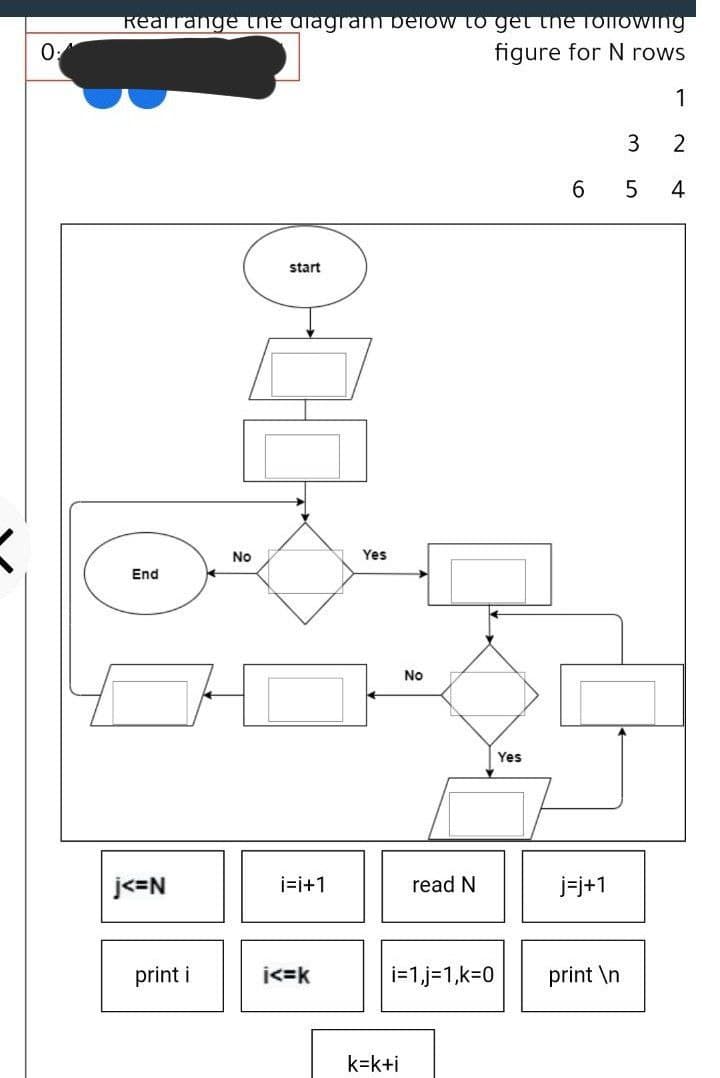
Rearrange tNe diagram DETOW to get the Tollowing figure for N rows 1 3 2 5 4 start No Yes End No Yes


Q: Create a truth table for “Some of these kids are rude. Jimmy is one of these kids. Therefore, Jimmy…
A: Given statement is “Some of these kids are rude. Jimmy is one of these kids. Therefore, Jimmy is…
Q: g to Bresenhem’s Algorithm. Also
A: Q
Q: Draw K map for a'+ab'c'+abc (Use table as reference)
A:
Q: SOLVE THE BELOW PROBLEMS CONSIDERING GIVEN TABLES. PK EMP FK EMPNO ENAME MGR DEPTNO SAL COMMISSION…
A: Since you have posted a question with multiple sub-parts, we will solve the first three sub-parts…
Q: tate the result for each: Provide explanation:
A: Given diagram: -
Q: The ternary joint is the joint that involves: Choose the right answer None of the mentioned Six…
A: In a graph when three edges are connected to the same point then it is called ternary joint. In the…
Q: Construct the table to find out the common in spanking and amputation.
A: Here is the solution:-
Q: H Which of the two graphs above correspond to the matrix representation below? |1 1 |1 1 1 1 1 1 1 1…
A: The correct answer along with the explanation is given below: Adjacency Matrix An Adjacency Matrix…
Q: Where can I get a multplication table
A: C Program to Generate Multiplication Table: Multiplication Table Up to 10
Q: Create a 10 random data set using rand syntax in scilab. Solve for the first 5 order of moment both…
A: Code: x=100*rand(10,1)muX=mean(x);n=10; //Function that defines the rth moment about the…
Q: Convert the following NFA's to DFA's. Begin by showing the value of ɛClosure(q) for each : 1
A: €closure of initial state of NFA will be initial state of DFA. Any state of DFA that contains any…
Q: We can describe the following figure as:
A: As per the question statement, We need to provide the answer for the given questions.
Q: How to construct a truth table for ~[ (p ↔ q) ^ (r v ~p) ] → ~q
A: A→B gives us 0 only if A is 1 and B is 0 and gives 1 in all other cases AvB gives us 0 only if both…
Q: Please Explain the cardinality ratios of the Er diagram
A: Cardinality Ratios are: Many to Many (M: N) Many to One (M: 1) One to Many (1: M) One to One (1:…
Q: provide step by step answer
A: Step1: transaction 1: User1 sends 1BTC to different address from Address1 to Address2, so…
Q: lease explain step by step (see attached photo) the process of this solution of the running time in…
A: The image represents the calculation of the time complexity for the code fragment present in the…
Q: explain the difference between (pi), (p-hat), and p-value
A: explain the difference between (pi), (p-hat), and p-value
Q: Minimize the given below DFA using Myhill-Nerode theorem/Table filling method [All steps should be…
A: Answer-
Q: how to calculate correlation coefficient in python for logistic regression
A: Please give positive ratings for my efforts. Thanks. I have written a python code which will serve…
Q: what is a lim,n and what is the order of convergence of the sequence?
A:
Q: You have been given the following data show in table 6.4 6.5 6.6 y 1.5 9.5 15.3 6.6 based on these…
A: Here, Data is given in the table.
Q: Use the truth tables method to determine whether p - (q ^ ¬q) and -p are logically (1 .equivalent…
A: 1) p->(q∧¬q) and ¬p are logically equivalent or not. SOLUTION: p q ¬p ¬q q∧¬q p->(q∧¬q)…
Q: • Based on the graph given, perform the following: 3. DFS @ 11: (Highest Data Value) 4. BFS @ 11:…
A: Dfs-depth first search Bfs-bredth first search Dfs consists stack data structure Bfs consists queue…
Q: 4) Troth table of (1).
A: In the given circuit, AND,OR,Not gates are used2 input AND gate: output is only 1 when both inputs…
Q: Explain the follow
A: A command interpreter is a piece of system software that interprets and executes commands that are…
Q: What is K Map and how to make table through k map and how to grouping 1) Implement Half Subtractor…
A: K-Map (Karnaugh Map) The graphical technique of simplifying Boolean expressions is known as the…
Q: There are tow methods that used to reduce the state .... table are
A: There are two methods that used to reduce the state table are ...
Q: Think of a requirement for a need to use a pivot table and scatter diagram, then create the pivot…
A: A Pivot Table is used to summarise, sort, reorganize, group, count, total or average data stored in…
Q: Problem List with Expected Results Problem 1 For all departments, display department number and the…
A: To satisfy the given requirement, SQL code was developed using Oracle as below ((the question did…
Q: Explain each graph 35000 South-East Asia Africa 30000 25000 20000 15000 10000 5000 50 100 150 200…
A: In this question we have to explain the functionality of the graph and what exactly they are…
Q: Write down the working principle of Region Merging Algorithm.
A: The ability to segment images is critical to our interpretation of them. As a result, a lot of time…
Q: Build the best Decision Tree for following table. Explain the process and all equations are used.
A: Decision Tree:
Q: an ER
A: Given :- A relation table is mention in the above given question Need to draw an ERD (Entity…
Q: Minimize the given below DFA using Myhill-Nerode theorem/Table filling method [All steps should be…
A: Given :- In the above question, a deterministic finite automata (or machine) is mention in the above…
Q: Q. Represent the graph below using Adjacency Matrix and Adjacency List. I 3
A: ANSWER : We can easily represent graphs using the following ways, 1. Adjacency matrix 2.…
Q: draw traceability matrix for food donation ann
A: Given draw traceability matrix for food donation app
Q: KMP -- What are tables next and fail for the pattern ABCABDABB. Show how the answer is derived.
A: Given pattern is ABCABDABB Rules:Prefix: For a string, all substrings from first character to non…
Q: Minimize the given below DFA using Myhill-Nerode theorem/Table filling method [All steps should be…
A: Minimization of DFA is required to achieve the simplest and most equivalent version of any DFA with…
Q: If the sum of the index values in the sequence model is 28, what is the TMU and its time equivalent…
A: Answer is in next step
Q: Answer below graph question 2. 2 Intersection 4
A: HI THEREI AM ADDING ANSWER BELOWPLEASE GO THROUGH ITTHANK YOU
Q: Briefly explain denormalize
A: Denormalization is strategy that database managers use to increase the performance of a database…
Q: Using the sequence definitions 2, -1, k= 1,2 elsewhere, k =0 -2, k=0,1,2 k = 3,4 elsewhere x(k) 1,…
A:
Q: Rearrange tNE diagram DETOW to get the Toilowing figure for N rows 1 6 5 4 start
A: Tilted rectangle is for input output operation while simple rectangle is to perform operation.
Q: The known data sequence is (130, 116, 48492, 8, 236, 350, 66, 25, 371), please give the schematic…
A: Radix sort is based on sorting significant value of a number first sort ones value, next hundreds…
Q: What is K Map and how to make table through k map and how to grouping
A: As per the guidelines we are supposed to answer only one question. Kindly repost other question as a…
Q: What is the Jaccard similarity coefficient between these two phrasess: 1; "Flower Busket" and 2:…
A: Answer to the above question of Jaccard coefficient is in step2.
Q: step by step with proper explanation.
A: I have solved below the following question:

Step by step
Solved in 2 steps with 1 images

- The park service records the number of reported rattle snake sightings on Bald Mountain Trail and Camel Back Trail. The data gives rise to the following two bar graphs. Rattlesnake Sightings on Bald Mountain Trail Rattlesnake Sightings on Camel Back Trail 2468101214Year201620172018[Graphs generated by this script: setBorder(28,45,0,10); initPicture(0,8,0,15);axes(1000,2,1,1000,2); fill="blue"; textabs([190,0],"Year","above");rect([1,0],[3,15]);text([2,0],"2016","below");rect([3,0],[5,7]);text([4,0],"2017","below");rect([5,0],[7,1]);text([6,0],"2018","below");] 2468Year201620172018[Graphs generated by this script: setBorder(19,45,0,10); initPicture(0,8,0,8);axes(1000,2,1,1000,2); fill="blue"; textabs([190,0],"Year","above");rect([1,0],[3,1]);text([2,0],"2016","below");rect([3,0],[5,8]);text([4,0],"2017","below");rect([5,0],[7,5]);text([6,0],"2018","below");] Use the bar graphs to fill in the contingency table below. Reported Rattle Snake Sightings Year Trail 2016 2017…The park service records the number of reported rattle snake sightings on Bald Mountain Trail and Camel Back Trail. The data gives rise to the following stacked bar graph. Rattle Snake Sightings 1234567891011121314151617181920-1201620172018[Graphs generated by this script: initPicture(-0.5,6,-1,20);axes(10,1,1,10,1); fill='lightsteelblue'; rect([1,0],[2,3]); rect([2.5,0],[3.5,11]); rect([4,0],[5,6]); fill='gold'; rect([1,3],[2,8]); rect([2.5,11],[3.5,12]); rect([4,6],[5,9]); text([1.5,0],2016,'below');text([3,0],2017,'below');text([4.5,0],2018,'below'); fill='white' ;stroke='white';rect([-.5,-2],[.5,-.1]);] Bald Mountain Trail Camel Back Trail Use the stacked bar graph to fill in the contingency table below. Rattle Snake Sightings Year Trail 2016 2017 2018 Total Bald Mountain Camel Back TotalA weighted, directed graph is a suitable representation to represent the daily airline routes flown by a small airline. The airline have the following daily flights: - Three flights from Cape Town to Johannesburg, - Two flights from Johannesburg to Cape Town. - Four flights from Johannesburg to Durban. - Three flights from Durban to Johannesburg. - One flight from Johannesburg to George. - One flight from George to Johannesburg. Draw the graph and answer the questions that follow
- Please explain Some engineers at Google want you to implement a graph structure of the subway system in Boston showing the connections between each station.They are wondering what data structure to use to represent the graph and use the least amount of memory, given that most stations do not connect to many other stations. Which graph data structure representation should you use and why? Group of answer choices a. Adjacency List -- Because the complexity is O(V+E), the data structure is better at representing sparse graphs since their are fewer connections. b. Adjacency Matrix -- Because the complexity is O(V+E), the data structure is better at representing sparse graphs since their are fewer connections.procedure generate( G : group; P : property; s : 1..k+l; i : 1..k+1;[)'1, T2 ..... )'i-1] : initial segment of base image;var K : group );(* Generate the elements of G (s) whose base image startwith 1(1, T2 ..... 1I/-1 and that may have property P.If one is found then extend K, the subgroup of G (s) of elementswith property P that have already been found, and return to search. *) Algorithm to Backtrack Search Restricting Choice of Base ImagesCorrect answer will be upvoted else downvoted. Computer science. You are given a number n and an exhibit b1,b2,… ,bn+2, acquired by the accompanying calculation: some exhibit a1,a2,… ,a was speculated; cluster a was composed to exhibit b, for example bi=ai (1≤i≤n); The (n+1)- th component of the cluster b is the amount of the numbers in the exhibit a, for example bn+1=a1+a2+… +an; The (n+2)- th component of the cluster b was thought of some number x (1≤x≤109), for example bn+2=x; The cluster b was rearranged. For instance, the cluster b=[2,3,7,12,2] it very well may be acquired in the accompanying ways: a=[2,2,3] and x=12; a=[3,2,7] and x=2. For the given cluster b, find any exhibit a that might have been speculated at first. Input The main line contains a solitary integer t (1≤t≤104). Then, at that point, t experiments follow. The primary line of each experiment contains a solitary integer n (1≤n≤2⋅105). The second column of each experiment…
- A picture is worth a thousand words’ goes the saying: How much information is contained in a picture if the picture size is 250 x 400 pixels, and each pixel may take one of 256 colors with equal probability? Assume there are 60,000 words in a dictionary, and the 1000 words may be selected randomly from this dictionary. How much information do these 1000 words convey? What is the flaw in the above comparison?Array's positive and negative aspects?Algorithm 2 : Backtrack Search Restricting Choice of Base ImagesInput : a group G with a base B=[[51, [52 ..... [sk] and a strong generating set S;a decidable property P whose elements form a subgroup;Output : a strong generating set relative to B for the subgroup K = H (P) ;
- function [ ] = square_spectrum( L,N )%Activity 1 for CEN415 Summer 2022 x=linspace(0,2*L,200);f1=(-1).^floor(x/L);plot(x,f1)f2=0;for n=1:2:N, f2=f2+4*sin(n*pi.*x/L)/n/pi;endhold onplot(x,f2)hold offend 1-Run the function with L=3 and N=1 and upload the plotted graph use matlapMake an algorithm for this below: Construct a 6x6 table and populate the cells with alphabets from your address (68-9th Street, Nchanga South, Chingola) repeatedly. Design an effective algorithm to create and display the patterns "/ (diagonal)" in increasing and decreasing order. Merge and print any two patterns with maximum length from both increasing & decreasing orders and compress and print the same.The size of the intersection divided by the size of the union is used to determine how similar two papers are (each having unique words). For instance, the similarity between 1, 5, 3 and 1, 7, 2, 3 is 0, 4, as the intersection has size, if the documents are made up of integers.the union has a size of 2, andWe have a large collection of documents (each with a unique value and a corresponding ID), where the similarity is deemed to be "sparse":This means that there is a high likelihood of resemblance between any two randomly chosen papers. O. Create an algorithm that provides a list of document ID pairings together with the corresponding similarity.Only the pairings with similarity larger than 0 should be printed. Documents that are empty should not


