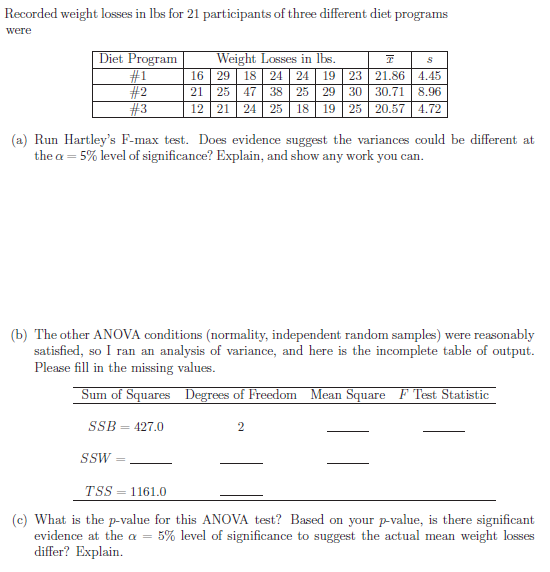
Recorded weight losses in lbs for 21 participants of three different diet programs were Diet Program Weight Losses in lbs. x s #1 16 29 18 24 24 19 23 21.86 4.45 #2 21 25 47 38 25 29 30 30.71 8.96 #3 12 21 24 25 18 19 25 20.57 4.72 (a) Run Hartley’s F-max test. Does evidence suggest the variances could be different at the α = 5% level of significance? Explain, and show any work you can. (b) The other ANOVA conditions (normality, independent random samples) were reasonably satisfied, so I ran an analysis of variance, and here is the incomplete table of output. Please fill in the missing values. Sum of Squares Degrees of Freedom Mean Square F Test Statistic SSB = 427.0 2 -------- ------------- SSW =---------- ------------- --------- TSS = 1161.0 ------------ (c) What is the p-value for this ANOVA test? Based on your p-value, is there significant evidence at the α = 5% level of significance to suggest the actual mean weight losses differ? Explain.


Recorded weight losses in lbs for 21 participants of three different diet programs were
Diet Program Weight Losses in lbs. x s
#1 16 29 18 24 24 19 23 21.86 4.45
#2 21 25 47 38 25 29 30 30.71 8.96
#3 12 21 24 25 18 19 25 20.57 4.72
(a) Run Hartley’s F-max test. Does evidence suggest the variances could be different at the α = 5% level of significance? Explain, and show any work you can.
(b) The other ANOVA conditions (normality, independent random samples) were reasonably satisfied, so I ran an analysis of variance, and here is the incomplete table of output.
Please fill in the missing values.
Sum of Squares Degrees of Freedom
SSB = 427.0 2 -------- -------------
SSW =---------- ------------- ---------
TSS = 1161.0 ------------
(c) What is the p-value for this ANOVA test? Based on your p-value, is there significant evidence at the α = 5% level of significance to suggest the actual mean weight losses differ? Explain.


Trending now
This is a popular solution!

Step by step
Solved in 6 steps


