Refer to the graph below. Find the producer surplus for the supply function, S, when x=20. Hint: think about the area that represents the producer surplus.
Refer to the graph below. Find the producer surplus for the supply function, S, when x=20. Hint: think about the area that represents the producer surplus.

Chapter3: Functions
Section3.3: Rates Of Change And Behavior Of Graphs
Problem 26SE: Table 3 gives the annual sales (in millions of dollars) of a product from 1998 to 20006. What was...

Related questions
Question
#9
Transcribed Image Text:QUESTION 9
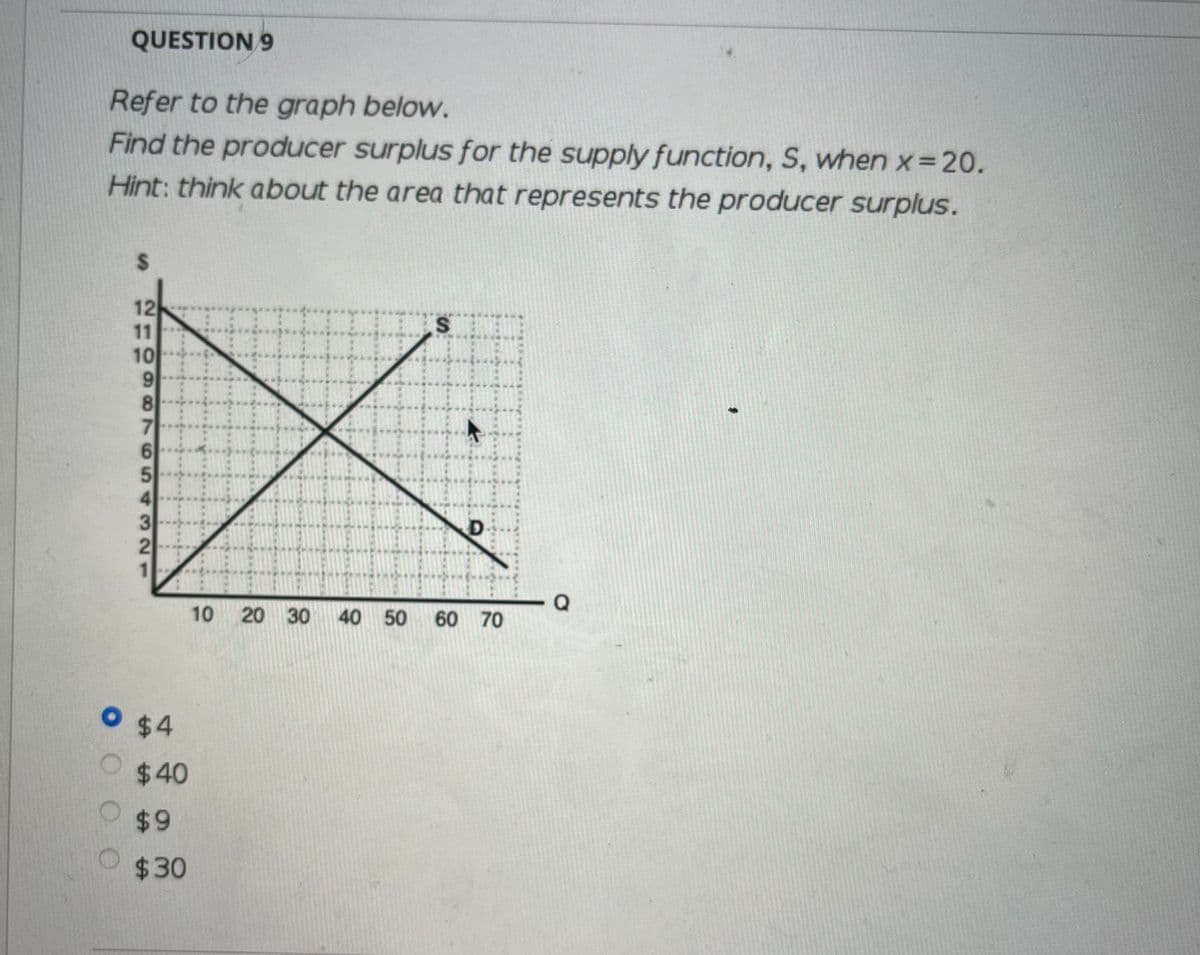
Refer to the graph below.
Find the producer surplus for the supply function, S, when x=20.
Hint: think about the area that represents the producer surplus.
%24
12
11
10
8
III
4
10
20 30
40 50
60 70
O $4
$40
6$
$30
321
Expert Solution
This question has been solved!
Explore an expertly crafted, step-by-step solution for a thorough understanding of key concepts.

Step by step
Solved in 2 steps with 1 images

Recommended textbooks for you

Algebra & Trigonometry with Analytic Geometry
Algebra
ISBN:
9781133382119
Author:
Swokowski
Publisher:
Cengage
Algebra & Trigonometry with Analytic Geometry
Algebra
ISBN:
9781133382119
Author:
Swokowski
Publisher:
Cengage