Required Calculate the following ratios for Year 4 and Year 3. Since Year 2 numbers are not presented do not use averages when calculating the ratios for Year 3. Instead, use the number presented on the Year 3 balance sheet. a. Working capital. b. Current ratio. (Round your answers to 2 decimal places.) c. Quick ratio. (Round your answers to 2 decimal places.) d. Receivables turnover (beginning receivables at January 1, Year 3, were $47,000). (Round your answers to 2 decimal places.) e. Average days to collect accounts receivable. (Use 365 days in a year. Round your intermediate calculations to 2 decimal places and your final answers to the nearest whole number.) f. Inventory turnover (beginning inventory at January 1, Year 3, was $140,000). (Round your answers to 2 decimal places.) g. Number of days to sell inventory. (Use 365 days in a year. Round your intermediate calculations to 2 decimal places and your final answers to the nearest whole number.) h. Debt-to-assets ratio. (Round your answers to the nearest whole percent.) i. Debt-to-equity ratio. (Round your answers to 2 decimal places.) j. Number of times interest was earned. (Round your answers to 2 decimal places.) k. Plant assets to long-term debt. (Round your answers to 2 decimal places.) I. Net margin. (Round your answers to 2 decimal places.) m. Turnover of assets (average total assets in Year 3 is $540,000). (Round your answers to 2 decimal places.) n. Return on investment (average total assets in Year 3 is $540,000). (Round your answers to 2 decimal places.) o. Return on equity (average stockholders' equity in Year 3 is $292,000). (Round your answers to 2 decimal places.) p. Earnings per share (total shares outstanding is unchanged). (Round your answers to 2 decimal places.) q. Book value per share of common stock. (Round your answers to 2 decimal places.) r. Price-earnings ratio (market price per share: Year 3, $11.75; Year 4, $12.50). (Round your intermediate calculations and final answer to 2 decimal places.) s. Dividend yield on common stock. (Round your answers to 2 decimal places.) Year 4 Year 3 a. Working capital b. Current ratio c. Quick ratio Receivables turnover (beginning receivables at January 1, Year 3, were $47,000) $ 122,200 1.80 $ 120,000 1.99 times times |days d. e. Average days to collect accounts receivable days f. Inventory turnover (beginning inventory at January 1, Year 3, was $140,000) times times g. Number of days to sell inventory days days h. Debt-to-assets ratio i. Debt-to-equity ratio j. Number of times interest was earned k. Plant assets to long-term debt 1. Net margin m. Turnover of assets (average total assets in Year 3 is $540,000) % % times times % % n. Return on investment (average total assets in Year 3 is $540,000) % % o. Return on equity (average stockholders' equity in Year 3 is $292,000) % % p. Earnings per share (total shares outstanding is unchanged) per share per share q. Book value per share of common stock r. Price-earnings ratio (market price per share: Year 3, $11.75; Year 4, $12.50) per share per share S. Dividend yield on common stock % %
Required Calculate the following ratios for Year 4 and Year 3. Since Year 2 numbers are not presented do not use averages when calculating the ratios for Year 3. Instead, use the number presented on the Year 3 balance sheet. a. Working capital. b. Current ratio. (Round your answers to 2 decimal places.) c. Quick ratio. (Round your answers to 2 decimal places.) d. Receivables turnover (beginning receivables at January 1, Year 3, were $47,000). (Round your answers to 2 decimal places.) e. Average days to collect accounts receivable. (Use 365 days in a year. Round your intermediate calculations to 2 decimal places and your final answers to the nearest whole number.) f. Inventory turnover (beginning inventory at January 1, Year 3, was $140,000). (Round your answers to 2 decimal places.) g. Number of days to sell inventory. (Use 365 days in a year. Round your intermediate calculations to 2 decimal places and your final answers to the nearest whole number.) h. Debt-to-assets ratio. (Round your answers to the nearest whole percent.) i. Debt-to-equity ratio. (Round your answers to 2 decimal places.) j. Number of times interest was earned. (Round your answers to 2 decimal places.) k. Plant assets to long-term debt. (Round your answers to 2 decimal places.) I. Net margin. (Round your answers to 2 decimal places.) m. Turnover of assets (average total assets in Year 3 is $540,000). (Round your answers to 2 decimal places.) n. Return on investment (average total assets in Year 3 is $540,000). (Round your answers to 2 decimal places.) o. Return on equity (average stockholders' equity in Year 3 is $292,000). (Round your answers to 2 decimal places.) p. Earnings per share (total shares outstanding is unchanged). (Round your answers to 2 decimal places.) q. Book value per share of common stock. (Round your answers to 2 decimal places.) r. Price-earnings ratio (market price per share: Year 3, $11.75; Year 4, $12.50). (Round your intermediate calculations and final answer to 2 decimal places.) s. Dividend yield on common stock. (Round your answers to 2 decimal places.) Year 4 Year 3 a. Working capital b. Current ratio c. Quick ratio Receivables turnover (beginning receivables at January 1, Year 3, were $47,000) $ 122,200 1.80 $ 120,000 1.99 times times |days d. e. Average days to collect accounts receivable days f. Inventory turnover (beginning inventory at January 1, Year 3, was $140,000) times times g. Number of days to sell inventory days days h. Debt-to-assets ratio i. Debt-to-equity ratio j. Number of times interest was earned k. Plant assets to long-term debt 1. Net margin m. Turnover of assets (average total assets in Year 3 is $540,000) % % times times % % n. Return on investment (average total assets in Year 3 is $540,000) % % o. Return on equity (average stockholders' equity in Year 3 is $292,000) % % p. Earnings per share (total shares outstanding is unchanged) per share per share q. Book value per share of common stock r. Price-earnings ratio (market price per share: Year 3, $11.75; Year 4, $12.50) per share per share S. Dividend yield on common stock % %

Cornerstones of Financial Accounting
4th Edition
ISBN:9781337690881
Author:Jay Rich, Jeff Jones
Publisher:Jay Rich, Jeff Jones
Chapter9: Long-term Liabilities
Section: Chapter Questions
Problem 103.4C

Related questions
Question
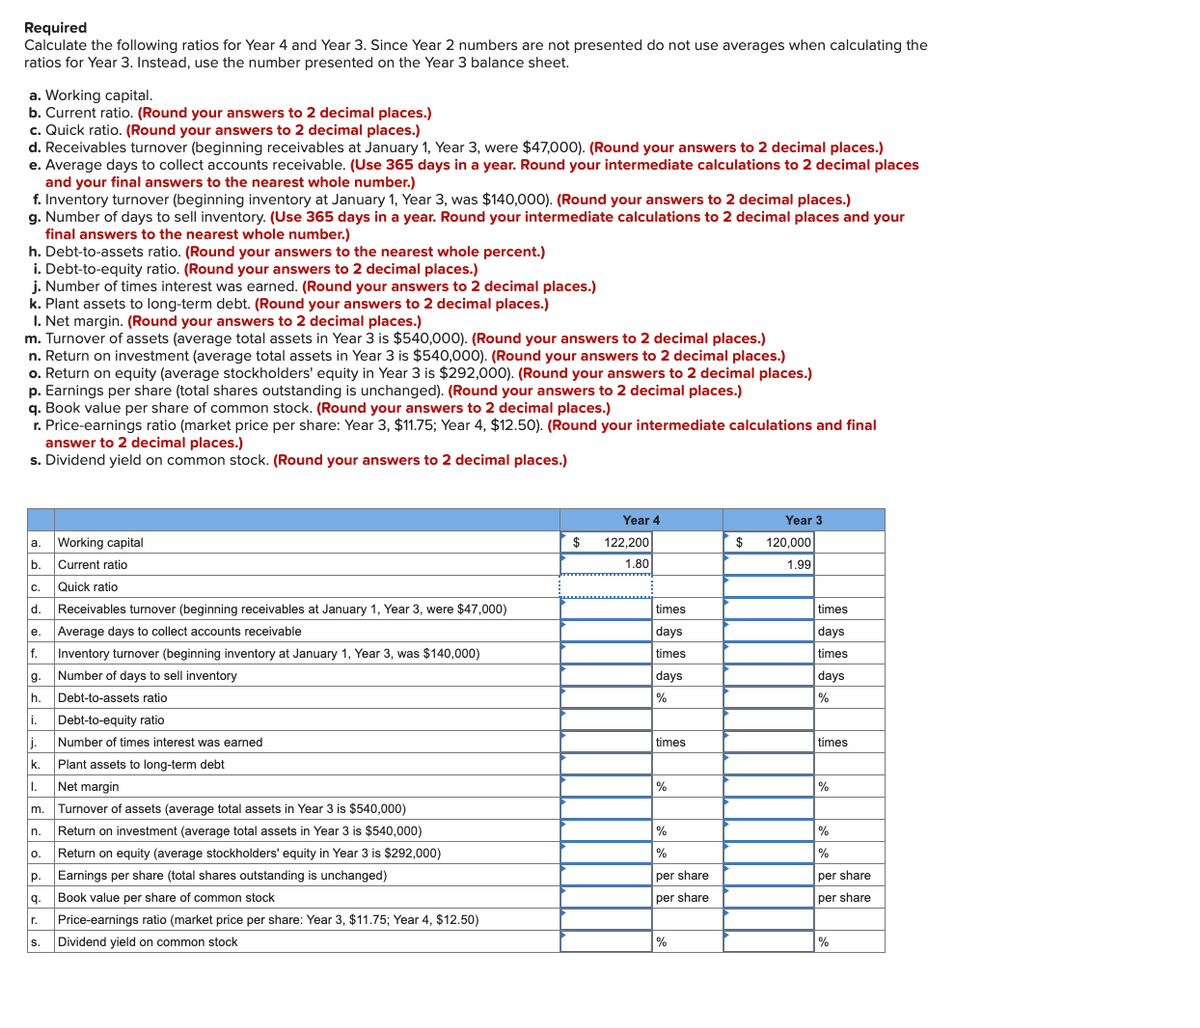
Transcribed Image Text:Required
Calculate the following ratios for Year 4 and Year 3. Since Year 2 numbers are not presented do not use averages when calculating the
ratios for Year 3. Instead, use the number presented on the Year 3 balance sheet.
a. Working capital.
b. Current ratio. (Round your answers to 2 decimal places.)
c. Quick ratio. (Round your answers to 2 decimal places.)
d. Receivables turnover (beginning receivables at January 1, Year 3, were $47,000). (Round your answers to 2 decimal places.)
e. Average days to collect accounts receivable. (Use 365 days in a year. Round your intermediate calculations to 2 decimal places
and your final answers to the nearest whole number.)
f. Inventory turnover (beginning inventory at January 1, Year 3, was $140,000). (Round your answers to 2 decimal places.)
g. Number of days to sell inventory. (Use 365 days in a year. Round your intermediate calculations to 2 decimal places and your
final answers to the nearest whole number.)
h. Debt-to-assets ratio. (Round your answers to the nearest whole percent.)
i. Debt-to-equity ratio. (Round your answers to 2 decimal places.)
j. Number of times interest was earned. (Round your answers to 2 decimal places.)
k. Plant assets to long-term debt. (Round your answers to 2 decimal places.)
I. Net margin. (Round your answers to 2 decimal places.)
m. Turnover of assets (average total assets in Year 3 is $540,000). (Round your answers to 2 decimal places.)
n. Return on investment (average total assets in Year 3 is $540,000). (Round your answers to 2 decimal places.)
o. Return on equity (average stockholders' equity in Year 3 is $292,000). (Round your answers to 2 decimal places.)
p. Earnings per share (total shares outstanding is unchanged). (Round your answers to 2 decimal places.)
q. Book value per share of common stock. (Round your answers to 2 decimal places.)
r. Price-earnings ratio (market price per share: Year 3, $11.75; Year 4, $12.50). (Round your intermediate calculations and final
answer to 2 decimal places.)
s. Dividend yield on common stock. (Round your answers to 2 decimal places.)
Year 4
Year 3
а.
Working capital
$
122.200
$
120,000
b. Current ratio
1.80
1.99
C.
Quick ratio
d.
Receivables turnover (beginning receivables at January 1, Year 3, were $47,000)
times
times
Average days to collect accounts receivable
days
days
е.
f.
Inventory turnover (beginning inventory at January 1, Year 3, was $140,000)
times
times
g.
Number of days to sell inventory
days
days
h.
Debt-to-assets ratio
%
%
i.
j.
Plant assets to long-term debt
Debt-to-equity ratio
Number of times interest was earned
times
times
k.
1. Net margin
%
%
m.
Turnover of assets (average total assets in Year 3 is $540,000)
n.
Return on investment (average total assets in Year 3 is $540,000)
%
%
O.
Return on equity (average stockholders' equity in Year 3 is $292,000)
%
%
p.
Earnings per share (total shares outstanding is unchanged)
per share
per share
q. Book value per share of common stock
per share
per share
r.
Price-earnings ratio (market price per share: Year 3, $11.75; Year 4, $12.50)
Dividend yield on common stock
%
%
S.
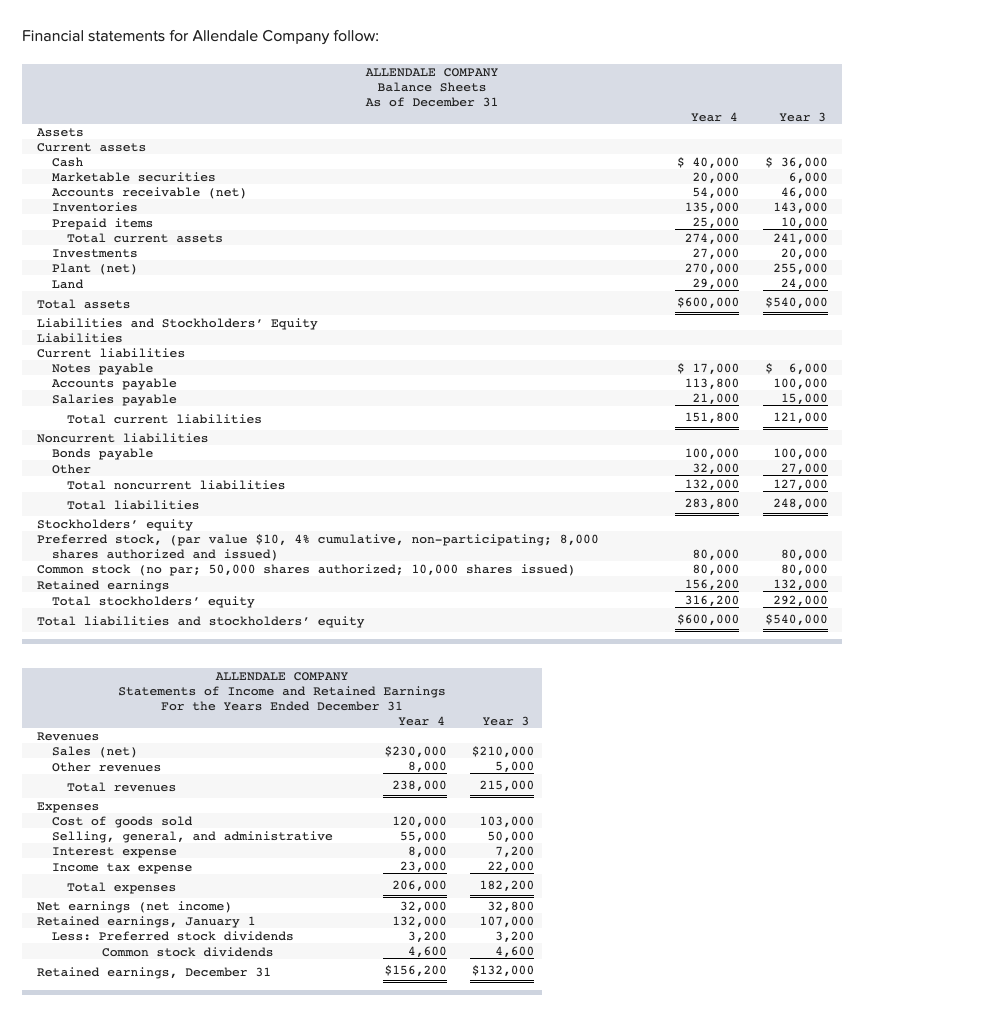
Transcribed Image Text:Financial statements for Allendale Company follow:
ALLENDALE COMPANY
Balance Sheets
As of December 31
Year 4
Year 3
Assets
Current assets
Cash
$ 40,000
$ 36,000
6,000
46,000
143,000
10,000
Marketable securities
20,000
54,000
135,000
25,000
Accounts receivable (net)
Inventories
Prepaid items
Total current assets
274,000
241,000
20,000
255,000
24,000
Investments
Plant (net)
27,000
270,000
29,000
Land
Total assets
$600,000
$540,000
Liabilities and Stockholders' Equity
Liabilities
Current liabilities
$ 17,000
Notes payable
Accounts payable
Salaries payable
113,800
21,000
$ 6,000
100,000
15,000
Total current liabilities
151,800
121,000
Noncurrent liabilities
Bonds payable
100,000
32,000
132,000
100,000
27,000
Other
Total noncurrent liabilities
127,000
Total liabilities
283,800
248,000
Stockholders' equity
Preferred stock, (par value $10, 4% cumulative, non-participating; 8,000
shares authorized and issued)
Common stock (no par; 50,000 shares authorized; 10,000 shares issued)
Retained earnings
Total stockholders' equity
80,000
80,000
80,000
80,000
156,200
132,000
292,000
316,200
Total liabilities and stockholders' equity
$600,000
$540,000
ALLENDALE COMPANY
Statements of Income and Retained Earnings
For the Years Ended December 31
Year 4
Year 3
Revenues
Sales (net)
$230,000
8,000
$210,000
Other revenues
5,000
Total revenues
238,000
215,000
Expenses
Cost of goods sold
Selling, general, and administrative
Interest expense
120,000
55,000
8,000
103,000
50,000
7,200
Income tax expense
23,000
22,000
Total expenses
206,000
182,200
32,000
132,000
3,200
4,600
32,800
107,000
3,200
4,600
Net earnings (net income)
Retained earnings, January 1
Less: Preferred stock dividends
Common stock dividends
Retained earnings, December 31
$156,200
$132,000
Expert Solution
This question has been solved!
Explore an expertly crafted, step-by-step solution for a thorough understanding of key concepts.

This is a popular solution!

Trending now
This is a popular solution!

Step by step
Solved in 2 steps with 1 images

Knowledge Booster


Learn more about
Need a deep-dive on the concept behind this application? Look no further. Learn more about this topic, accounting and related others by exploring similar questions and additional content below.Recommended textbooks for you
Cornerstones of Financial Accounting
Accounting
ISBN:
9781337690881
Author:
Jay Rich, Jeff Jones
Publisher:
Cengage Learning

EBK CONTEMPORARY FINANCIAL MANAGEMENT
Finance
ISBN:
9781337514835
Author:
MOYER
Publisher:
CENGAGE LEARNING - CONSIGNMENT

Financial Accounting
Accounting
ISBN:
9781337272124
Author:
Carl Warren, James M. Reeve, Jonathan Duchac
Publisher:
Cengage Learning
Cornerstones of Financial Accounting
Accounting
ISBN:
9781337690881
Author:
Jay Rich, Jeff Jones
Publisher:
Cengage Learning
EBK CONTEMPORARY FINANCIAL MANAGEMENT
Finance
ISBN:
9781337514835
Author:
MOYER
Publisher:
CENGAGE LEARNING - CONSIGNMENT
Financial Accounting
Accounting
ISBN:
9781337272124
Author:
Carl Warren, James M. Reeve, Jonathan Duchac
Publisher:
Cengage Learning

Managerial Accounting
Accounting
ISBN:
9781337912020
Author:
Carl Warren, Ph.d. Cma William B. Tayler
Publisher:
South-Western College Pub

Financial And Managerial Accounting
Accounting
ISBN:
9781337902663
Author:
WARREN, Carl S.
Publisher:
Cengage Learning,

Intermediate Accounting: Reporting And Analysis
Accounting
ISBN:
9781337788281
Author:
James M. Wahlen, Jefferson P. Jones, Donald Pagach
Publisher:
Cengage Learning