Results Set the following initial conditions, run the simulation, and complete the table below. (Note: After a run you can click on the graph to make a line appear. Drag the line to the year that you want to record the data for and it will appear in the data table below the graph). Biomass in kg/m² Foxes Biomass Rabbits Biomass Grass Biomass t= 0 500 kg/m 500 kg/m 500 kg/m t-50 t= 99 2. Below is a biomass diagram representing the initial conditions for trial 1. Sketch the final biomass diagram for part 1 (Notes: you can always get back to the lab book that records the data for each run by clicking the left button of the stopwatch to start a new run). 16 Foxes Foxes Rabbits Rabbits Grass Grass Final Part 1 Biomass
Results Set the following initial conditions, run the simulation, and complete the table below. (Note: After a run you can click on the graph to make a line appear. Drag the line to the year that you want to record the data for and it will appear in the data table below the graph). Biomass in kg/m² Foxes Biomass Rabbits Biomass Grass Biomass t= 0 500 kg/m 500 kg/m 500 kg/m t-50 t= 99 2. Below is a biomass diagram representing the initial conditions for trial 1. Sketch the final biomass diagram for part 1 (Notes: you can always get back to the lab book that records the data for each run by clicking the left button of the stopwatch to start a new run). 16 Foxes Foxes Rabbits Rabbits Grass Grass Final Part 1 Biomass

Biology Today and Tomorrow without Physiology (MindTap Course List)
5th Edition
ISBN:9781305117396
Author:Cecie Starr, Christine Evers, Lisa Starr
Publisher:Cecie Starr, Christine Evers, Lisa Starr
Chapter18: The Biosphere And Human Effects
Section: Chapter Questions
Problem 8SQ

Related questions

Concept explainers
Animal Diversity
Nematodes are commonly known as roundworms. They are free-living, very tiny organisms. They have an elongated and tubular body. These organisms have a nervous system and are mostly act as parasites to both animals and plants.
Platyhelminthes
Platyhelminthes are also known as "flatworms" because as they are dorsoventrally flattened from head to tail. They are invertebrate, soft-bodied, acoelomate, unsegmented and have bilateral symmetry.
Question
Can you help me with this pattens in biomass in ecosytems work for my bio class so basically so the meadow simulation to put data on the tables and then sketch the results on the graph thingy and then answer the question
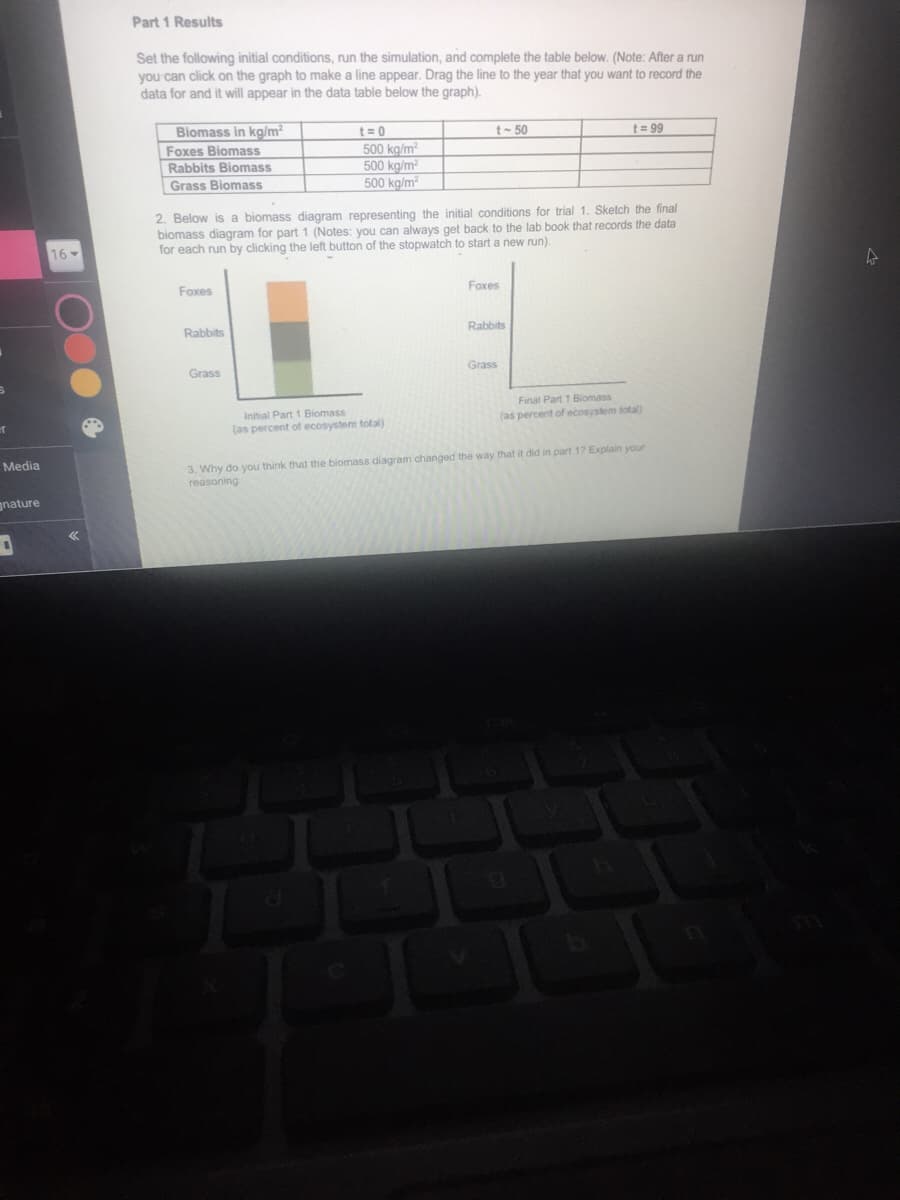
Transcribed Image Text:Part 1 Results
Set the following initial conditions, run the simulation, and complete the table below. (Note: After a run
you can click on the graph to make a line appear. Drag the line to the year that you want to record the
data for and it will appear in the data table below the graph).
Biomass in kg/m²
t=0
t-50
t= 99
Foxes Biomass
Rabbits Biomass
Grass Biomass
500 kg/m²
500 kg/m?
500 kg/m?
2. Below is a biomass diagram representing the initial conditions for trial 1. Sketch the final
biomass diagram for part 1 (Notes: you can always get back to the lab book that records the data
for each run by clicking the left button of the stopwatch to start a new run).
16
Foxes
Foxes
Rabbits
Rabbits
Grass
Grass
Initial Part 1 Biomass
(as percent of ecosystem total)
Final Part 1 Biomass
(as percent of ecosystem total)
er
3. Why do you think that the biomass diagram changed the way that it did in part 17 Explain your
reasoning
Media
gnature
Expert Solution
This question has been solved!
Explore an expertly crafted, step-by-step solution for a thorough understanding of key concepts.

This is a popular solution!

Trending now
This is a popular solution!

Step by step
Solved in 4 steps with 1 images

Knowledge Booster


Learn more about
Need a deep-dive on the concept behind this application? Look no further. Learn more about this topic, biology and related others by exploring similar questions and additional content below.Recommended textbooks for you
Biology Today and Tomorrow without Physiology (Mi…
Biology
ISBN:
9781305117396
Author:
Cecie Starr, Christine Evers, Lisa Starr
Publisher:
Cengage Learning
Biology Today and Tomorrow without Physiology (Mi…
Biology
ISBN:
9781305117396
Author:
Cecie Starr, Christine Evers, Lisa Starr
Publisher:
Cengage Learning