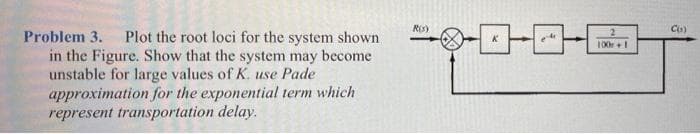
Ris) Co) Problem 3. Plot the root loci for the system shown 100 +1 in the Figure. Show that the system may become unstable for large values of K. use Pade approximation for the exponential term which represent transportation delay.


Q: 1. Following figure shows the one-line diagram of a two bus system. Take bus 1 as slack bus, bus 2…
A:
Q: True or false? Steady-state error describes the system's ability to track reference trajectories.…
A:
Q: a. In case of a two-machine system: i. Obtain an expression for steady state stability limit. ii.…
A:
Q: followed,disaster often * occure;these disaster are loss of human life O huge monetary costs O all…
A: When ethics is not followed, disaster happen it may be human life loss,it may be Environment impact,…
Q: HOME WORK For the simple distribution system shown in Figure below, use the probabilistic approach…
A: The given figure is shown below:
Q: Solve the following system of equations using the Gauss-Seidel iteration method. 6. 4x + 2y + z =…
A:
Q: Q1(6*1)/For the circuit shown in the figure :below, using nodal analysis to find
A: Given circuit-
Q: For the system shown below calculate the steady state error for (i) unit step input; (ii) unit ramp…
A: Since you have asked multiple questions in a single request, we will be answering only the 1st…
Q: For each of the following power systems, do following: 1. Compute the Y_bus in rectangular and polar…
A: We are authorized to answer three subparts at a time. Since you have not mentioned which part you…
Q: Q No. 2: For the open loop system given below evaluate the static error constants and find the…
A:
Q: 5-A short transmission line which is consist of series impedance and shunt capacitance. True False…
A: Note :- As per guidelines we are supposed to answer maximum of 3 True/False questions. So I request…
Q: Make the state space representation of the system given below with the method of phase variables.
A:
Q: N-R method of power flow solution follows the rectangular values of the quanities True False
A: N-R method of power flow solution follows both rectangular and polar values of quantities.
Q: Q: A 3 phas e, 50 HZ Transmission line (lo0km) delivers 50 MUA, o.8pf Lagging and (aokv), Long the…
A:
Q: QI (a) Table Q1(a) shows a list of electrical appliances for a typical 3 bedroom house. As an M&E…
A: “Since you have posted a question with multiple sub-parts, we will solve the first three sub-parts…
Q: Four industrial centers are located at the corners of a square of 35300 m side. The loads are 430000…
A:
Q: In an undisturbed sea level condition airstream, the velocity of the flow is 600 ft/s. What is the…
A: It is given that: v1=600 ft/sv2=680 ft/s
Q: In N-R method of power flow solution,the number of iteration required for the convergence is same as…
A: In this we will write about NR method...
Q: Problem 3: Consider the single generator connected to the infinite bus system with two transmission…
A: In the given question, it is given that there is a single generator that is being connected to the…
Q: PROBLEMS 141 a. Use the lambda iteration method to find the economic dispatch for a total demand of…
A:
Q: Using N-R method power flow solution, find AP2, AP3 and AQ2 also the first row and first column…
A: According to the question, Using the N-R method power flow solution, find AP2, AP3, and AQ2 also the…
Q: (b) Using Routh criterion to determine the location of roots and the stability of the system…
A: We need to find location of poles and stability of system .
Q: I Review | Constants The steady-state voltage drop between the load and the sending end of the line…
A:
Q: j0.1 2.0+j0.5 j0.4 j0.2 1.01 3.
A: This question is from "Power System". Under which we are going to find out the "Y-parameter of the…
Q: -than time constant of prime mover system. D. much greater 1. Time constant of excitation system is…
A: As per the guidelines given to us we can only provide the solution of three subpart in multi part…
Q: Q4/ Find the values of incremental fuel costs using LaGrangian multipliers for the two-unit system…
A:
Q: F,(P,) = 1000P, Baht 30 < P, < 150 MW F,(P,) = 1500P, Baht 40 < P, < 200 MW %3D %3D Bus 1 Bus 2…
A: Total load demand, Pd = 120 + 200 = 320 MW Since no losses…
Q: 1)For the following control system, use the Routh-Hurwitz criterion to determine if it is stable.If…
A: In a control system a system is said to be stable if the bounded input is applied to the system and…
Q: Q. No. 1. Figure I shows the single-line diagram of a simple four-bus system. Table 1 gives the line…
A: "Since you have asked a question with multiple subparts, I will answer only first three subparts of…
Q: ) Set up and solve the system of equations for the currents i, iz, and iz in the branches of the…
A: The detailed solution is attached with.
Q: Starting with the initial values (1, 1, 1), solve the following system of equations by the…
A: Given the system of equations x12-x22+x32=11x1x2+x22-3x3=3x1-x1x3+x2x3=6
Q: are complex power demands at bus-1 and bus-2 For the system shown in figure, Sp, and SD,…
A: we need to find out VAR rating of capacitor QG2 at bus-2 in MVAr.
Q: Q4/ Find the values of incremental fuel costs using LaGrangian multipliers for the two-unit system…
A: Answer -
Q: Q5. Assume that the following permanent outage data has been given for the system shown below:…
A: (a) In the given figure each parallel line consists of 138kV breaker, 138 kV line, Transformer and…
Q: 6.6. In the power system network shown in Figure 6.5, bus 1 is a slack bus wi V = 1.020° per unit…
A: In this question we will use Gauss siedel method to determine voltage at bus 2 and S1 and power loss…
Q: G. In AC OPF the locational marginal price (LMP) for different buses could be different due to (a)…
A: “Since you have asked multiple question, we will solve the first question for you. If you want any…
Q: The number of unknown variables in a power flow equation required to be solved in an 'n' bus system…
A: Classification of buses Load Bus: Known values: P and Q P: Real Power…
Q: convention V0 is real) and assume that I(t) = I0eiωt where I0 is a general complex number (which can…
A:
Q: Why do we sometimes multiply a row of a Routh table by a positive constant? O a. For making an even…
A:
Q: 4) Set up and solve the system of equations for the currents i, iz, and iz in the branches of the…
A: Apply KVL to the left loop, -10+1i1+2i3+30=0 1i1+2i3=-20----(1) Apply KVL to the…
Q: Which of the following is false for the system whose block diagram is given below? a) Static speed…
A:
Q: the distribution of loads among the generating units is called as economic dispatch. Select one:…
A: Economic load dispatch in the power system is very important in optimizing loads among the…
Q: Derive conditions for economics dispatch when generating stations are connected in parallel
A: Economic load dispatch means runs the generators at a condition where cost of power generation is…
Q: Example 8.4 The one line diagram of a simple three-bus power system is shown in the figure. Each…
A:
Q: A single line diagram of a system is shown in Fig. All the values are in per unit on a common base.…
A: The given circuit is shown below: V=1 p.u.P=1p.u.cosϕ=0.8 lagging
Q: Explain why electricity prices may vary with location. What is the difference between constraint…
A: According to guidelines we need to solve only the first question. According to the question, we have…
Q: 1. Gas insulated substation (GIS) use following gas for insulation a) CO2 b) Sulfur hexafluoride c)…
A: option " b" is correct. Gas Insulated Substation used Sulfur Hexaflouride gas for insulation.…
Q: %AY L. واحدة Which of the following Busbar arrangement has the best reliability Double Busbar…
A: SUB-STATION: The assembly of apparatus used to change some characteristic of electric supply is…
Q: 1 2 Customer
A: Radial distribution system: This is the type of distribution system in which power is consumed at…
Q: HOME WORK For the simple distribution system shown in Figure below, use the probabilistic approach…
A: As we have given : Ra1=Ra2=Ra3=Rc1=Rc2=Rc3=RaRb1=Rb2=Rb3=RbRa=Rb=0.990

Step by step
Solved in 2 steps with 2 images


- Derive the full solution to the driven LRC circuit shown below using complex exponentials. Start withKirchhoff’s rule for the loop and assume a complex V (t) = V0eiωt (where by convention V0 is real) andassume that I(t) = I0eiωt where I0 is a general complex number (which can be written quite generallyas I0 = |I0|e−iδ), and where one gets physical answers at the end by taking the real part of thecomplex answers. Find an algebraic complex expression that expresses the sum of the voltages. Solve this expression directly using algebra, no pictures of “phasors” really required. Factor out the solution to obtain|I0|, δ, Z (the complex impedance), and the voltages across each element as a function of time.If the values of real power and reactive power is specified for a bus, then it is called as PQ bus. Select one: True FalseSuppose a power system consists of two isolated regions: a western region and an eastern region. Five units have been committed to supply 3090 MW as shown below. The two systems are separated by a transmission line that can handle a maximum transfer of 550 MW in either direction. Calculate the spinning reserve for the overall system and for eachregion.
- Assume that the system recorded by the block diagram is reliable. a) Determine the position constant, kp, of velocity, kv, and of acceleration, ka, of the system. b) Determine the steady-state errors for a magnitude 5 input in step, ramp, and parabola, respectively.a) Calculate the unit ramp input steady state error (e_ss) for the following control system. b) Δ(s)=2s^3+2s^2+s+K calculate the range of K values over which the system is stable, given the characteristic polynomial.a) You have been employed as an electrical engineer by a power transmission company to design a short transmission line to supply power to a light-industrial load consumer with power system specification as follows, a 3-ph, 60Hz overhead short transmission line with a line-to-line voltage of 23KV at the load end, line impedance of 2.48 ±j6.57Ω/phase, the industry has a cumulative consumption of 9MW with a power factor of 0.85 of lagging as a result of several induction motor on its production lines.As part of the regulations for connections to the grid, you are to provide justifications and values to the Energy Commission of Ghana.(i) What would be value of the voltage between the live conductor and the neutral, between live and live voltages at the industrial premises of the factory?(ii) What load angle would expect the factory to be operating at?
- Use DFT method to compute the circular convolution of x(n)={4,4} and h(n)={2, 6}.S.2) The serial impedance of the 300 km power transmission line is 23 + j75 ohm / phase and the shunt acceptance is j500 microS / phase. A power of 50 MW with a power factor of 0.88 under 220 kV interphase voltage from the end of the power transmission line being shot. Using these data of the energy transmission line, a) Characteristic impedance of the energy transmission line, b) Natural apparent power of the energy transmission line according to the 220 kV interphase operating voltage, c) The values of the line parameters A, B, C and D of the transmission line using hyperbolic functions, d) Calculate the maximum power that the power transmission line can transmit.The sample large power system network data's are given below, The total number of buses is 5 Three-phase short circuit fault subjected at the bus 5 The initial voltage of the faulted bus is 1.0 p.u The Zbus matrix element Z55 is 0.704 p.u Fault impedance Zf= 0.33 p.u Fault current (If )in p.u ..........
- Consider a radial distribution system given in figure below supplied by a 100% reliable source and consisting of two feeders connected in series. Each feeder has Tf = 5000 h and Tr = 5 h. Calculate the Reliability Indices and total system availability (A). Mathematically prove that parallel interconnection is going to increase reliability for the above scenario.How do distributed energy resources (DERs) such as solar panels and wind turbines impact the operation and planning of power systems? Analyze their integration challenges.Discuss the future trends and technologies in power systems, such as microgrids and energy storage systems.