rom the velocity vs. time graph(s), determine the ball's acceleration independently for each component of the motion as a function of time. What is the ball's acceleration just after it is thrown and just before it is caught or lands? What is the magnitude of the ball’s acceleration at its highest point? Is this value reasonable?
rom the velocity vs. time graph(s), determine the ball's acceleration independently for each component of the motion as a function of time. What is the ball's acceleration just after it is thrown and just before it is caught or lands? What is the magnitude of the ball’s acceleration at its highest point? Is this value reasonable?

Related questions
Question
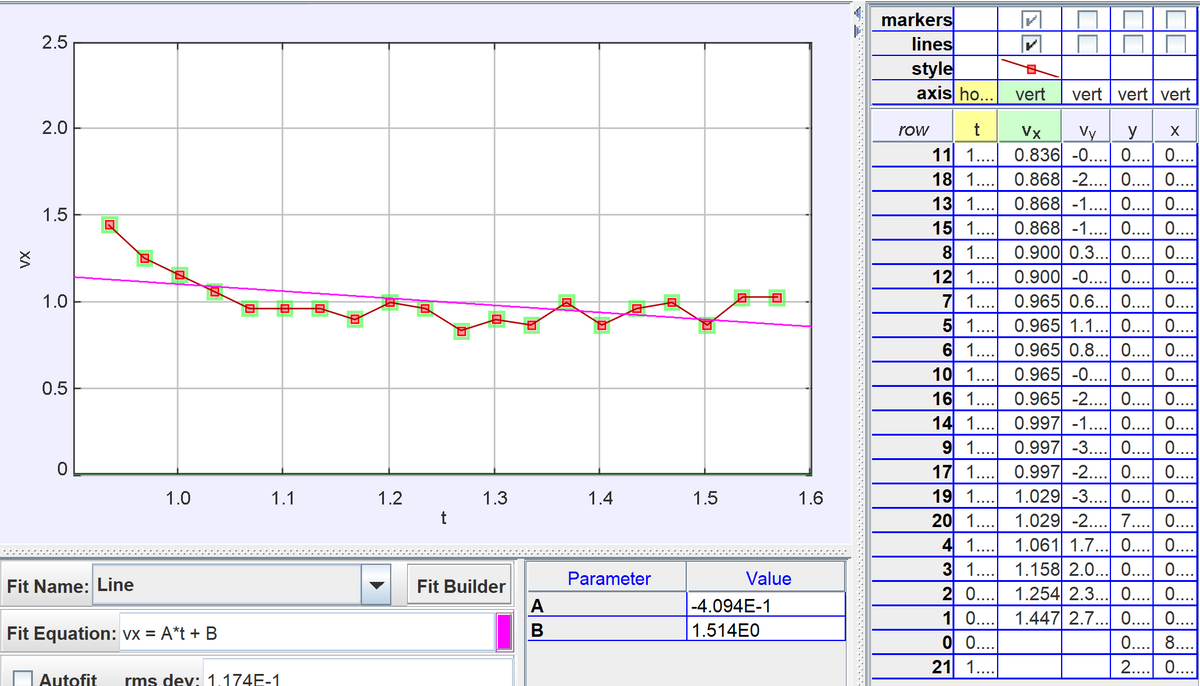
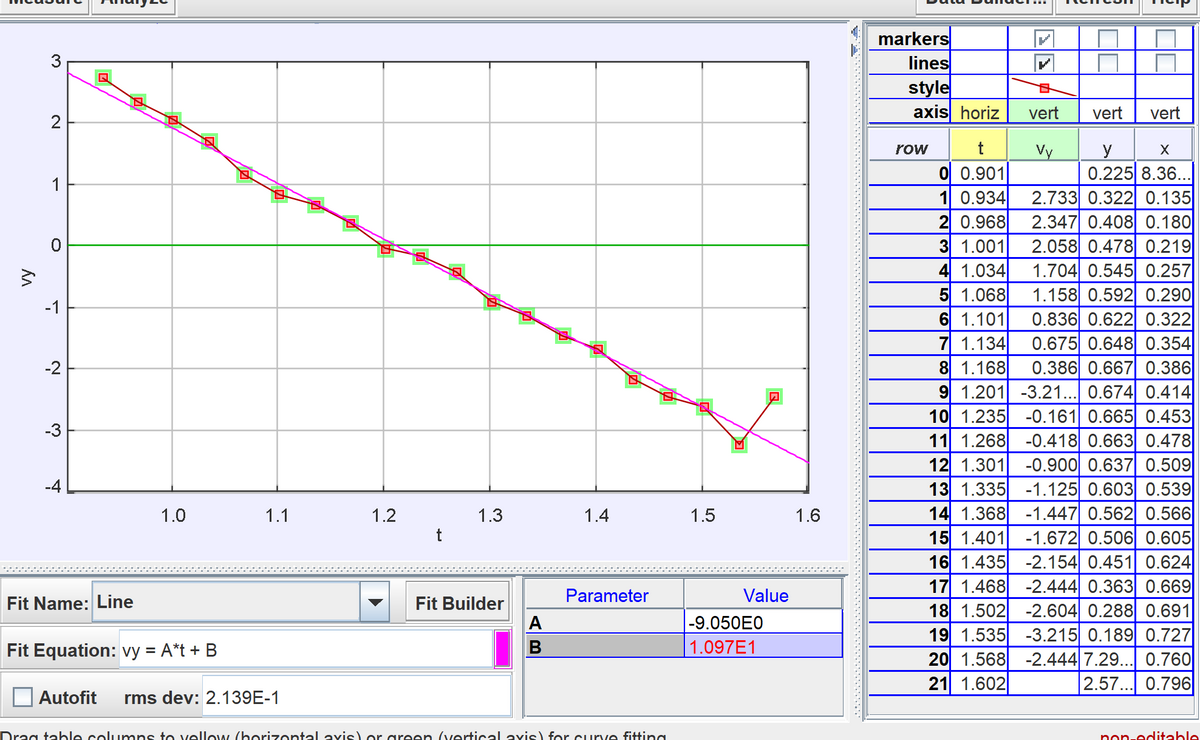
I am doing a lab report for my physics class. The lab consists of throwing a ball upward and recording its movements. Please explain these next questions and how you got the answer. The graphs attached below are my data for the ball in the x and y direction.
From the velocity vs. time graph(s), determine the ball's acceleration independently for each component of the motion as a function of time. What is the ball's acceleration just after it is thrown and just before it is caught or lands? What is the magnitude of the ball’s acceleration at its highest point? Is this value reasonable?
Transcribed Image Text:markers
lines
style
axis ho...
2.5
vert
vert vert vert
2.0
row
t
Vy
11 1.. 0.836 -0.... 0.... 0...
18 1... 0.868 -2.... 0.... 0....
Vx
y
13 1.. 0.868 -1... 0.. 0..
15 1.... 0.868 -1.... 0.... 0....
1.5
8 1.. 0.900 0.3... 0.. 0...
12 1.. 0.900 -0.... 0.... 0...
7 1.. 0.965 0.6... 0.... 0....
5 1.. 0.965| 1.1... 0.... 0....
6 1.. 0.965 0.8... 0.. 0...
10 1.. 0.965 -0.... 0.... 0....
16 1.. 0.965 -2.... 0.... 0...
14 1.. 0.997 -1.... 0.... 0....
9 1.. 0.997 -3.... 0... 0..
17 1.. 0.997 -2..
19 1.. 1.029 -3... 0.... 0...
20 1....
4 1....
1.0
0.5
0.... 0....
1.0
1.1
1.2
1.3
1.4
1.5
1.6
t
1.029 -2....
7.... 0....
1.061 1.7... 0.... 0...
1.158 2.0.. 0.... 0.
1.254 2.3... 0.... 0....
3 1...
Parameter
Value
Fit Name: Line
Fit Builder
2 0....
A
|-4.094E-1
1 0....
O 0....
1.447 2.7... 0.... 0..
0.... 8....
Fit Equation: vx = A*t + B
В
1.514E0
21 1..
2... 0....
Autofit
rms dev: 1.174E-1
XA
Transcribed Image Text:markers
lines
style
axis horiz
3
vert
vert
vert
2
row
t
y
0.225 8.36...
2.733 0.322 0.135
2.347 0.408 0.180
2.058 0.478 0.219
1.704 0.545 0.257
1.158 0.592 0.290|
0.836 0.622 0.322
0.675 0.648 0.354
0.386 0.667 0.386
Vy
0 0.901
1 0.934
2 0.968
3 1.001
4 1.034
5 1.068
6 1.101
7 1.134
8 1.168
9 1.201 -3.21... 0.674 0.414
10 1.235 -0.161 0.665 0.453
11 1.268 -0.418 0.663 0.478
12 1.301
13 1.335 -1.125 0.603 0.539
14 1.368 -1.447 0.562 0.566
15 1.401
16 1.435 -2.154 0.451 0.624
17 1.468 -2.444 0.363 0.669
18 1.502 -2.604 0.288 0.691
19 1.535 -3.215 0.189 0.727
20 1.568 -2.444 7.29... 0.760
21 1.602
1
-1
-2
-3
-0.900 0.637 0.509
-4
1.0
1.1
1.2
1.3
1.4
1.5
1.6
-1.672 0.506 0.605
Parameter
Value
Fit Builder
A
Fit Name: Line
-9.050E0
Fit Equation: vy = A*t + B
1.097E1
2.57... 0.796
Autofit
rms dev: 2.139E-1
Drag table columns to velIlow (horizontal avis) or areen (vertical avis) for curve fitting
non-editable
Expert Solution
This question has been solved!
Explore an expertly crafted, step-by-step solution for a thorough understanding of key concepts.

This is a popular solution!

Trending now
This is a popular solution!

Step by step
Solved in 2 steps
