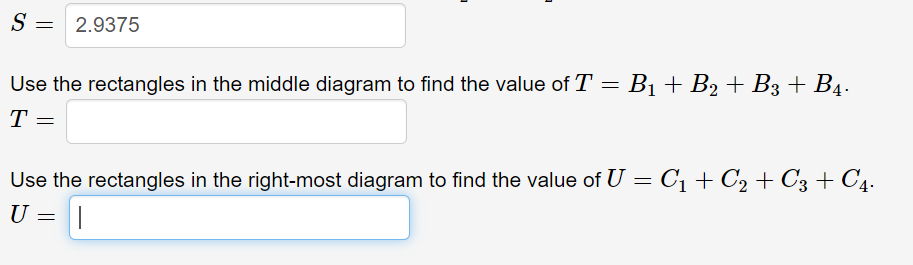
S = 2.9375 Use the rectangles in the middle diagram to find the value of T = B1 + B2 + B3 + B4. T = Use the rectangles in the right-most diagram to find the value of U = C1 + C2 + C3+ C4. U = |
S = 2.9375 Use the rectangles in the middle diagram to find the value of T = B1 + B2 + B3 + B4. T = Use the rectangles in the right-most diagram to find the value of U = C1 + C2 + C3+ C4. U = |

Functions and Change: A Modeling Approach to College Algebra (MindTap Course List)
6th Edition
ISBN:9781337111348
Author:Bruce Crauder, Benny Evans, Alan Noell
Publisher:Bruce Crauder, Benny Evans, Alan Noell
Chapter2: Graphical And Tabular Analysis
Section2.1: Tables And Trends
Problem 1TU: If a coffee filter is dropped, its velocity after t seconds is given by v(t)=4(10.0003t) feet per...

Related questions
Question
Please solve for T and U
Transcribed Image Text:S = 2.9375
Use the rectangles in the middle diagram to find the value of T =
B1 + B2 + B3 + B4.
T =
Use the rectangles in the right-most diagram to find the value of U = C1 + C2 + C3 + C4.
U
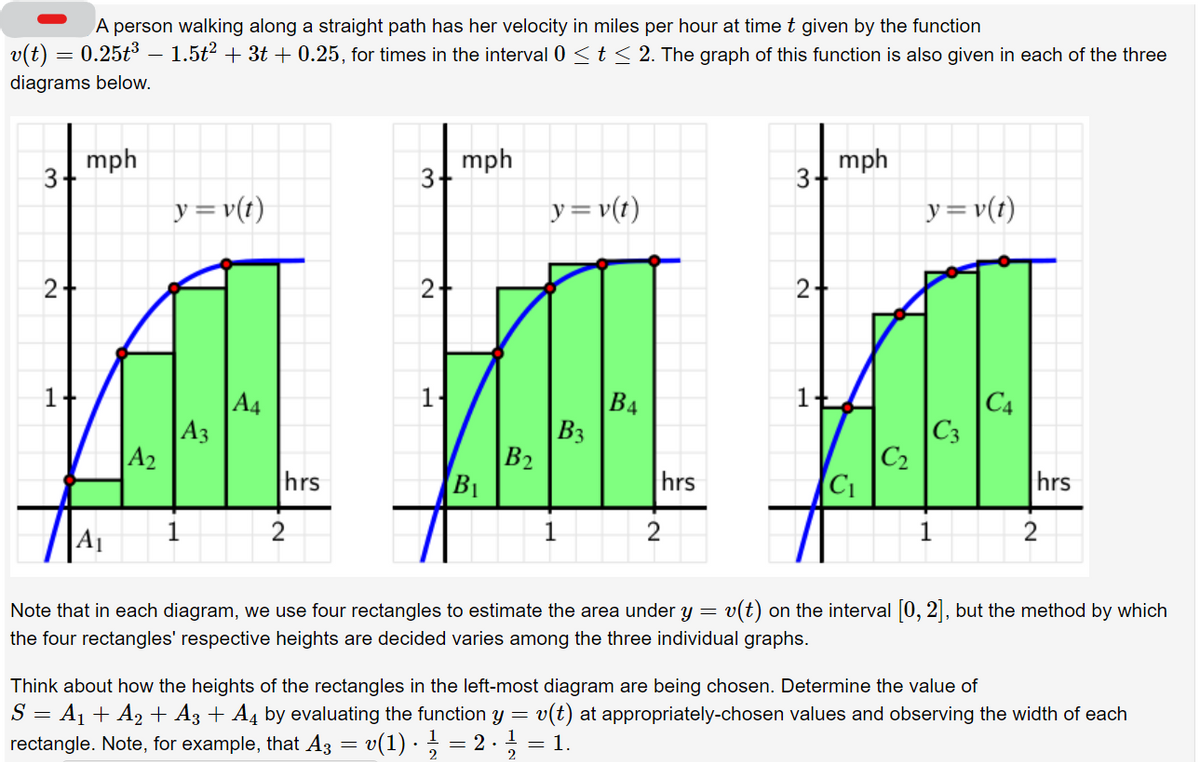
Transcribed Image Text:A person walking along a straight path has her velocity in miles per hour at timet given by the function
v(t) = 0.25t3 – 1.5t? + 3t + 0.25, for times in the interval 0 <t< 2. The graph of this function is also given in each of the three
diagrams below.
mph
mph
3-
mph
y=v(t)
y=v(t)
y=v(t)
2-
2+
1
A4
A3
A2
B4
B3
B2
C4
|C3
|C2
hrs
B1
hrs
C1
hrs
1
1
2
1
A1
Note that in each diagram, we use four rectangles to estimate the area under y = v(t) on the interval 0, 2 , but the method by which
the four rectangles' respective heights are decided varies among the three individual graphs.
Think about how the heights of the rectangles in the left-most diagram are being chosen. Determine the value of
S = A1 + A2 + A3 + A4 by evaluating the function y =
rectangle. Note, for example, that A3 = v(1) · = 2. =
v(t) at appropriately-chosen values and observing the width of each
= 1.
2
Expert Solution
This question has been solved!
Explore an expertly crafted, step-by-step solution for a thorough understanding of key concepts.

This is a popular solution!

Trending now
This is a popular solution!

Step by step
Solved in 4 steps

Recommended textbooks for you
Functions and Change: A Modeling Approach to Coll…
Algebra
ISBN:
9781337111348
Author:
Bruce Crauder, Benny Evans, Alan Noell
Publisher:
Cengage Learning

Algebra and Trigonometry (MindTap Course List)
Algebra
ISBN:
9781305071742
Author:
James Stewart, Lothar Redlin, Saleem Watson
Publisher:
Cengage Learning

Big Ideas Math A Bridge To Success Algebra 1: Stu…
Algebra
ISBN:
9781680331141
Author:
HOUGHTON MIFFLIN HARCOURT
Publisher:
Houghton Mifflin Harcourt
Functions and Change: A Modeling Approach to Coll…
Algebra
ISBN:
9781337111348
Author:
Bruce Crauder, Benny Evans, Alan Noell
Publisher:
Cengage Learning
Algebra and Trigonometry (MindTap Course List)
Algebra
ISBN:
9781305071742
Author:
James Stewart, Lothar Redlin, Saleem Watson
Publisher:
Cengage Learning
Big Ideas Math A Bridge To Success Algebra 1: Stu…
Algebra
ISBN:
9781680331141
Author:
HOUGHTON MIFFLIN HARCOURT
Publisher:
Houghton Mifflin Harcourt

Algebra & Trigonometry with Analytic Geometry
Algebra
ISBN:
9781133382119
Author:
Swokowski
Publisher:
Cengage

Trigonometry (MindTap Course List)
Trigonometry
ISBN:
9781337278461
Author:
Ron Larson
Publisher:
Cengage Learning
